Immigrants from Egypt vs Black/African American Child Poverty Among Boys Under 16
COMPARE
Immigrants from Egypt
Black/African American
Child Poverty Among Boys Under 16
Child Poverty Among Boys Under 16 Comparison
Immigrants from Egypt
Blacks/African Americans
14.9%
CHILD POVERTY AMONG BOYS UNDER 16
96.2/ 100
METRIC RATING
97th/ 347
METRIC RANK
24.5%
CHILD POVERTY AMONG BOYS UNDER 16
0.0/ 100
METRIC RATING
334th/ 347
METRIC RANK
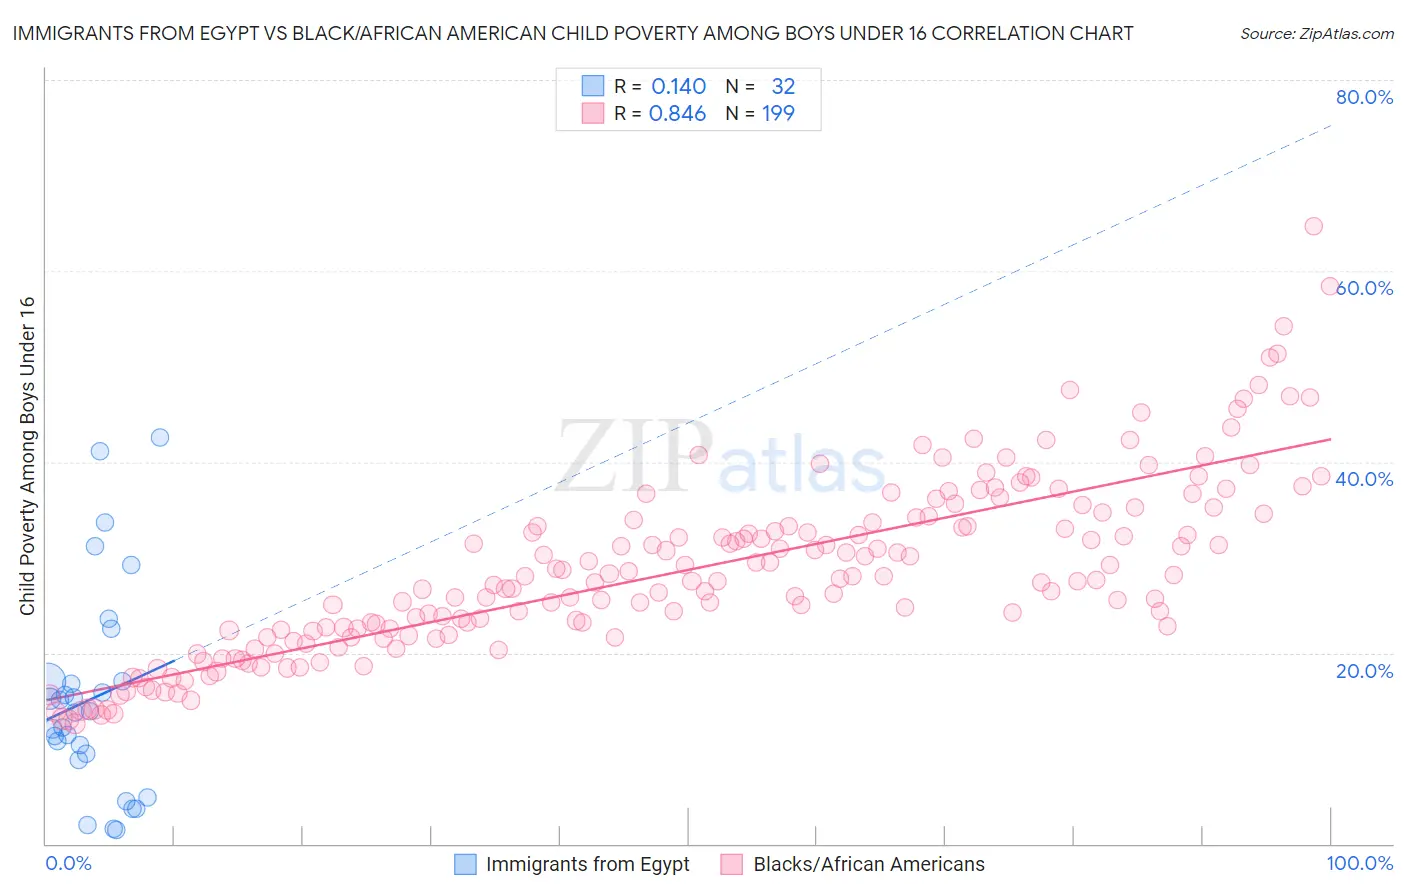
Immigrants from Egypt vs Black/African American Child Poverty Among Boys Under 16 Correlation Chart
The statistical analysis conducted on geographies consisting of 242,739,180 people shows a poor positive correlation between the proportion of Immigrants from Egypt and poverty level among boys under the age of 16 in the United States with a correlation coefficient (R) of 0.140 and weighted average of 14.9%. Similarly, the statistical analysis conducted on geographies consisting of 548,051,875 people shows a very strong positive correlation between the proportion of Blacks/African Americans and poverty level among boys under the age of 16 in the United States with a correlation coefficient (R) of 0.846 and weighted average of 24.5%, a difference of 64.1%.
Child Poverty Among Boys Under 16 Correlation Summary
| Measurement | Immigrants from Egypt | Black/African American |
| Minimum | 1.4% | 12.5% |
| Maximum | 42.5% | 64.6% |
| Range | 41.1% | 52.1% |
| Mean | 15.2% | 28.6% |
| Median | 13.8% | 27.6% |
| Interquartile 25% (IQ1) | 9.0% | 21.9% |
| Interquartile 75% (IQ3) | 17.0% | 34.0% |
| Interquartile Range (IQR) | 8.0% | 12.1% |
| Standard Deviation (Sample) | 10.7% | 9.3% |
| Standard Deviation (Population) | 10.5% | 9.3% |
Similar Demographics by Child Poverty Among Boys Under 16
Demographics Similar to Immigrants from Egypt by Child Poverty Among Boys Under 16
In terms of child poverty among boys under 16, the demographic groups most similar to Immigrants from Egypt are Immigrants from North Macedonia (14.9%, a difference of 0.010%), British (15.0%, a difference of 0.040%), Immigrants from France (15.0%, a difference of 0.14%), Finnish (14.9%, a difference of 0.26%), and Sri Lankan (14.9%, a difference of 0.37%).
| Demographics | Rating | Rank | Child Poverty Among Boys Under 16 |
| Austrians | 97.1 /100 | #90 | Exceptional 14.8% |
| Paraguayans | 96.8 /100 | #91 | Exceptional 14.9% |
| Argentineans | 96.7 /100 | #92 | Exceptional 14.9% |
| Sri Lankans | 96.7 /100 | #93 | Exceptional 14.9% |
| Immigrants | Italy | 96.7 /100 | #94 | Exceptional 14.9% |
| Finns | 96.5 /100 | #95 | Exceptional 14.9% |
| Immigrants | North Macedonia | 96.3 /100 | #96 | Exceptional 14.9% |
| Immigrants | Egypt | 96.2 /100 | #97 | Exceptional 14.9% |
| British | 96.2 /100 | #98 | Exceptional 15.0% |
| Immigrants | France | 96.1 /100 | #99 | Exceptional 15.0% |
| Chileans | 95.8 /100 | #100 | Exceptional 15.0% |
| Immigrants | Belarus | 95.7 /100 | #101 | Exceptional 15.0% |
| Romanians | 95.6 /100 | #102 | Exceptional 15.0% |
| Immigrants | Denmark | 95.6 /100 | #103 | Exceptional 15.0% |
| Immigrants | Switzerland | 95.4 /100 | #104 | Exceptional 15.0% |
Demographics Similar to Blacks/African Americans by Child Poverty Among Boys Under 16
In terms of child poverty among boys under 16, the demographic groups most similar to Blacks/African Americans are Apache (24.5%, a difference of 0.12%), Immigrants from Dominican Republic (24.3%, a difference of 0.84%), Yup'ik (24.7%, a difference of 0.85%), Dominican (24.2%, a difference of 1.4%), and Colville (24.1%, a difference of 1.8%).
| Demographics | Rating | Rank | Child Poverty Among Boys Under 16 |
| Immigrants | Honduras | 0.0 /100 | #327 | Tragic 22.8% |
| Pueblo | 0.0 /100 | #328 | Tragic 23.5% |
| Natives/Alaskans | 0.0 /100 | #329 | Tragic 24.0% |
| Colville | 0.0 /100 | #330 | Tragic 24.1% |
| Dominicans | 0.0 /100 | #331 | Tragic 24.2% |
| Immigrants | Dominican Republic | 0.0 /100 | #332 | Tragic 24.3% |
| Apache | 0.0 /100 | #333 | Tragic 24.5% |
| Blacks/African Americans | 0.0 /100 | #334 | Tragic 24.5% |
| Yup'ik | 0.0 /100 | #335 | Tragic 24.7% |
| Sioux | 0.0 /100 | #336 | Tragic 25.3% |
| Cheyenne | 0.0 /100 | #337 | Tragic 25.8% |
| Hopi | 0.0 /100 | #338 | Tragic 25.9% |
| Houma | 0.0 /100 | #339 | Tragic 26.2% |
| Crow | 0.0 /100 | #340 | Tragic 26.3% |
| Immigrants | Yemen | 0.0 /100 | #341 | Tragic 28.9% |