Immigrants from South Central Asia vs Black/African American Child Poverty Among Boys Under 16
COMPARE
Immigrants from South Central Asia
Black/African American
Child Poverty Among Boys Under 16
Child Poverty Among Boys Under 16 Comparison
Immigrants from South Central Asia
Blacks/African Americans
12.7%
CHILD POVERTY AMONG BOYS UNDER 16
100.0/ 100
METRIC RATING
11th/ 347
METRIC RANK
24.5%
CHILD POVERTY AMONG BOYS UNDER 16
0.0/ 100
METRIC RATING
334th/ 347
METRIC RANK
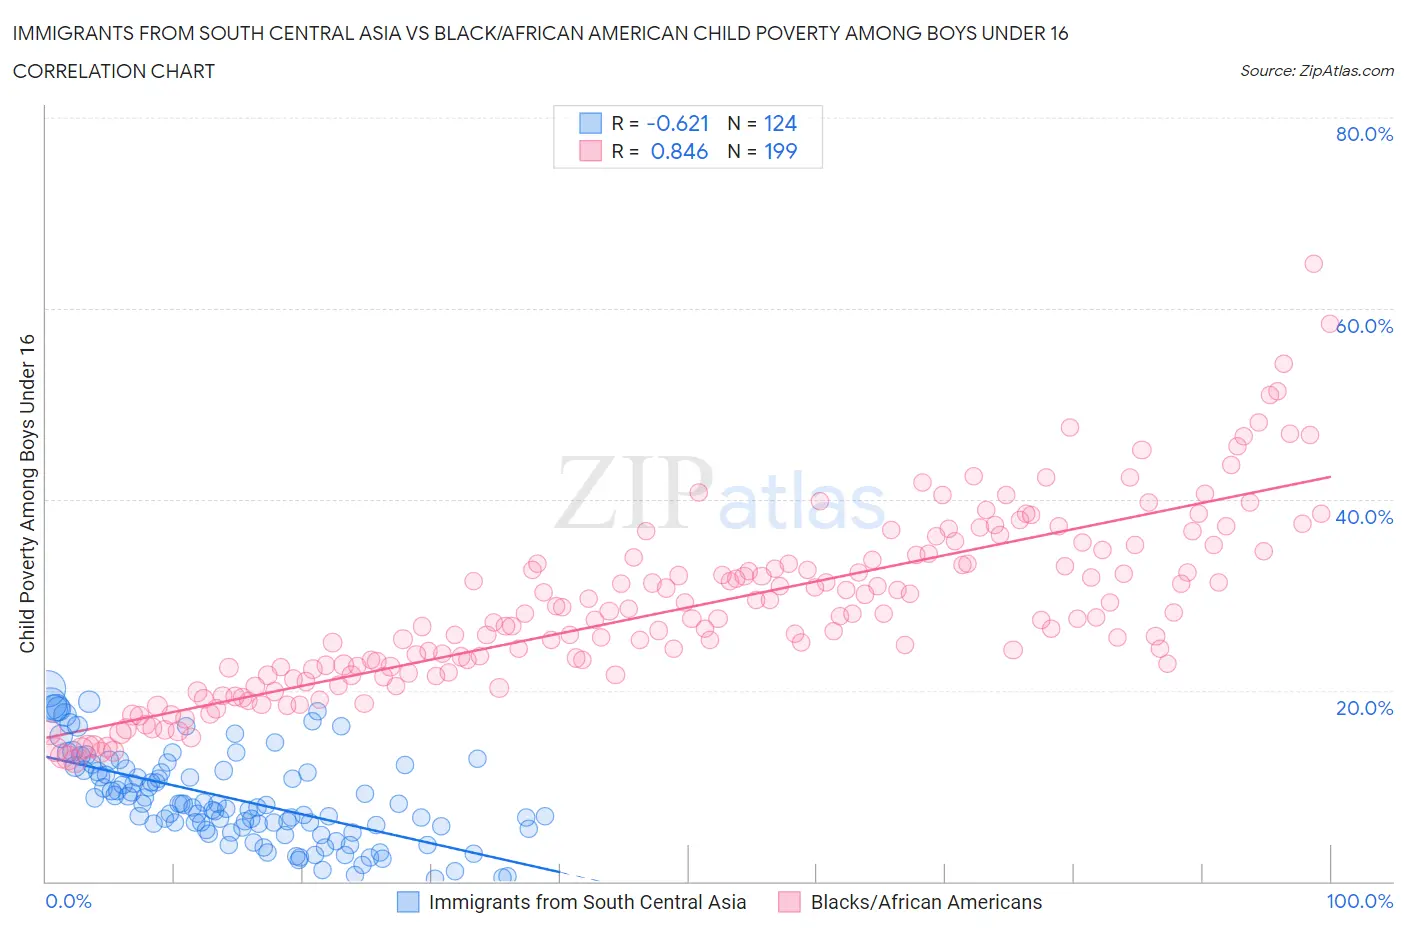
Immigrants from South Central Asia vs Black/African American Child Poverty Among Boys Under 16 Correlation Chart
The statistical analysis conducted on geographies consisting of 462,302,909 people shows a significant negative correlation between the proportion of Immigrants from South Central Asia and poverty level among boys under the age of 16 in the United States with a correlation coefficient (R) of -0.621 and weighted average of 12.7%. Similarly, the statistical analysis conducted on geographies consisting of 548,051,875 people shows a very strong positive correlation between the proportion of Blacks/African Americans and poverty level among boys under the age of 16 in the United States with a correlation coefficient (R) of 0.846 and weighted average of 24.5%, a difference of 93.7%.
Child Poverty Among Boys Under 16 Correlation Summary
| Measurement | Immigrants from South Central Asia | Black/African American |
| Minimum | 0.23% | 12.5% |
| Maximum | 20.2% | 64.6% |
| Range | 19.9% | 52.1% |
| Mean | 8.6% | 28.6% |
| Median | 8.0% | 27.6% |
| Interquartile 25% (IQ1) | 5.5% | 21.9% |
| Interquartile 75% (IQ3) | 11.6% | 34.0% |
| Interquartile Range (IQR) | 6.1% | 12.1% |
| Standard Deviation (Sample) | 4.7% | 9.3% |
| Standard Deviation (Population) | 4.7% | 9.3% |
Similar Demographics by Child Poverty Among Boys Under 16
Demographics Similar to Immigrants from South Central Asia by Child Poverty Among Boys Under 16
In terms of child poverty among boys under 16, the demographic groups most similar to Immigrants from South Central Asia are Bhutanese (12.6%, a difference of 0.52%), Immigrants from Iran (12.5%, a difference of 0.88%), Immigrants from Singapore (12.5%, a difference of 1.4%), Iranian (12.4%, a difference of 1.7%), and Burmese (13.0%, a difference of 2.4%).
| Demographics | Rating | Rank | Child Poverty Among Boys Under 16 |
| Thais | 100.0 /100 | #4 | Exceptional 11.7% |
| Chinese | 100.0 /100 | #5 | Exceptional 11.9% |
| Immigrants | Hong Kong | 100.0 /100 | #6 | Exceptional 12.3% |
| Iranians | 100.0 /100 | #7 | Exceptional 12.4% |
| Immigrants | Singapore | 100.0 /100 | #8 | Exceptional 12.5% |
| Immigrants | Iran | 100.0 /100 | #9 | Exceptional 12.5% |
| Bhutanese | 100.0 /100 | #10 | Exceptional 12.6% |
| Immigrants | South Central Asia | 100.0 /100 | #11 | Exceptional 12.7% |
| Burmese | 99.9 /100 | #12 | Exceptional 13.0% |
| Immigrants | Korea | 99.9 /100 | #13 | Exceptional 13.0% |
| Immigrants | Ireland | 99.9 /100 | #14 | Exceptional 13.1% |
| Immigrants | Japan | 99.9 /100 | #15 | Exceptional 13.1% |
| Maltese | 99.9 /100 | #16 | Exceptional 13.2% |
| Norwegians | 99.9 /100 | #17 | Exceptional 13.2% |
| Bulgarians | 99.9 /100 | #18 | Exceptional 13.3% |
Demographics Similar to Blacks/African Americans by Child Poverty Among Boys Under 16
In terms of child poverty among boys under 16, the demographic groups most similar to Blacks/African Americans are Apache (24.5%, a difference of 0.12%), Immigrants from Dominican Republic (24.3%, a difference of 0.84%), Yup'ik (24.7%, a difference of 0.85%), Dominican (24.2%, a difference of 1.4%), and Colville (24.1%, a difference of 1.8%).
| Demographics | Rating | Rank | Child Poverty Among Boys Under 16 |
| Immigrants | Honduras | 0.0 /100 | #327 | Tragic 22.8% |
| Pueblo | 0.0 /100 | #328 | Tragic 23.5% |
| Natives/Alaskans | 0.0 /100 | #329 | Tragic 24.0% |
| Colville | 0.0 /100 | #330 | Tragic 24.1% |
| Dominicans | 0.0 /100 | #331 | Tragic 24.2% |
| Immigrants | Dominican Republic | 0.0 /100 | #332 | Tragic 24.3% |
| Apache | 0.0 /100 | #333 | Tragic 24.5% |
| Blacks/African Americans | 0.0 /100 | #334 | Tragic 24.5% |
| Yup'ik | 0.0 /100 | #335 | Tragic 24.7% |
| Sioux | 0.0 /100 | #336 | Tragic 25.3% |
| Cheyenne | 0.0 /100 | #337 | Tragic 25.8% |
| Hopi | 0.0 /100 | #338 | Tragic 25.9% |
| Houma | 0.0 /100 | #339 | Tragic 26.2% |
| Crow | 0.0 /100 | #340 | Tragic 26.3% |
| Immigrants | Yemen | 0.0 /100 | #341 | Tragic 28.9% |