Aleut vs Guyanese Child Poverty Among Boys Under 16

COMPARE

Aleut
Race
Ancestry
AfghanAfricanAlaska NativeAlaskan AthabascanAlbanianAleutAlsatianAmericanApacheArabArapahoArgentineanArmenianAssyrian/Chaldean/SyriacAustralianAustrianBahamianBangladeshiBarbadianBasqueBelgianBelizeanBermudanBhutaneseBlackfeetBolivianBrazilianBritishBritish West IndianBulgarianBurmeseCajunCambodianCanadianCape VerdeanCarpatho RusynCelticCentral AmericanCentral American IndianCherokeeCheyenneChickasawChileanChineseChippewaChoctawColombianColvilleComancheCosta RicanCreeCreekCroatianCrowCubanCypriotCzechCzechoslovakianDanishDelawareDominicanDutchDutch West IndianEastern EuropeanEcuadorianEgyptianEnglishEstonianEthiopianEuropeanFijianFilipinoFinnishFrenchFrench American IndianFrench CanadianGermanGerman RussianGhanaianGreekGuamanian/ChamorroGuatemalanHaitianHmongHonduranHopiHoumaHungarianIcelanderIndian (Asian)IndonesianInupiatIranianIraqiIrishIroquoisIsraeliItalianJamaicanJapaneseJordanianKenyanKiowaKoreanLaotianLatvianLebaneseLiberianLithuanianLumbeeLuxembourgerMacedonianMalaysianMalteseMarshalleseMenomineeMexicanMexican American IndianMongolianMoroccanNative HawaiianNavajoNepaleseNew ZealanderNicaraguanNigerianNorthern EuropeanNorwegianOkinawanOsageOttawaPaiutePakistaniPalestinianPanamanianParaguayanPennsylvania GermanPeruvianPimaPolishPortuguesePotawatomiPuebloPuerto RicanPuget Sound SalishRomanianRussianSalvadoranSamoanScandinavianScotch-IrishScottishSeminoleSenegaleseSerbianShoshoneSierra LeoneanSiouxSlavicSlovakSloveneSomaliSouth AfricanSouth AmericanSouth American IndianSoviet UnionSpaniardSpanishSpanish AmericanSpanish American IndianSri LankanSubsaharan AfricanSudaneseSwedishSwissSyrianTaiwaneseThaiTlingit-HaidaTohono O'OdhamTonganTrinidadian and TobagonianTsimshianTurkishU.S. Virgin IslanderUgandanUkrainianUruguayanUteVenezuelanVietnameseWelshWest IndianYakamaYaquiYugoslavianYumanYup'ikZimbabwean
Immigration
NonimmigrantsImmigrantsAfghanistanAfricaAlbaniaArgentinaArmeniaAsiaAustraliaAustriaBahamasBangladeshBarbadosBelarusBelgiumBelizeBoliviaBosnia and HerzegovinaBrazilBulgariaBurma/MyanmarCabo VerdeCambodiaCameroonCanadaCaribbeanCentral AmericaChileChinaColombiaCongoCosta RicaCroatiaCubaCzechoslovakiaDenmarkDominicaDominican RepublicEastern AfricaEastern AsiaEastern EuropeEcuadorEgyptEl SalvadorEnglandEritreaEthiopiaEuropeFijiFranceGermanyGhanaGreeceGrenadaGuatemalaGuyanaHaitiHondurasHong KongHungaryIndiaIndonesiaIranIraqIrelandIsraelItalyJamaicaJapanJordanKazakhstanKenyaKoreaKuwaitLaosLatin AmericaLatviaLebanonLiberiaLithuaniaMalaysiaMexicoMicronesiaMiddle AfricaMoldovaMoroccoNepalNetherlandsNicaraguaNigeriaNorth AmericaNorth MacedoniaNorthern AfricaNorthern EuropeNorwayOceaniaPakistanPanamaPeruPhilippinesPolandPortugalRomaniaRussiaSaudi ArabiaScotlandSenegalSerbiaSierra LeoneSingaporeSomaliaSouth AfricaSouth AmericaSouth Central AsiaSouth Eastern AsiaSouthern EuropeSpainSri LankaSt. Vincent and the GrenadinesSudanSwedenSwitzerlandSyriaTaiwanThailandTrinidad and TobagoTurkeyUgandaUkraineUruguayUzbekistanVenezuelaVietnamWest IndiesWestern AfricaWestern AsiaWestern EuropeYemenZaireZimbabweAzores
Guyanese
Race
Ancestry
AfghanAfricanAlaska NativeAlaskan AthabascanAlbanianAlsatianAmericanApacheArabArapahoArgentineanArmenianAssyrian/Chaldean/SyriacAustralianAustrianBahamianBangladeshiBarbadianBasqueBelgianBelizeanBermudanBhutaneseBlackfeetBolivianBrazilianBritishBritish West IndianBulgarianBurmeseCajunCambodianCanadianCape VerdeanCarpatho RusynCelticCentral AmericanCentral American IndianCherokeeCheyenneChickasawChileanChineseChippewaChoctawColombianColvilleComancheCosta RicanCreeCreekCroatianCrowCubanCypriotCzechCzechoslovakianDanishDelawareDominicanDutchDutch West IndianEastern EuropeanEcuadorianEgyptianEnglishEstonianEthiopianEuropeanFijianFilipinoFinnishFrenchFrench American IndianFrench CanadianGermanGerman RussianGhanaianGreekGuamanian/ChamorroGuatemalanGuyaneseHaitianHmongHonduranHopiHoumaHungarianIcelanderIndian (Asian)IndonesianInupiatIranianIraqiIrishIroquoisIsraeliItalianJamaicanJapaneseJordanianKenyanKiowaKoreanLaotianLatvianLebaneseLiberianLithuanianLumbeeLuxembourgerMacedonianMalaysianMalteseMarshalleseMenomineeMexicanMexican American IndianMongolianMoroccanNative HawaiianNavajoNepaleseNew ZealanderNicaraguanNigerianNorthern EuropeanNorwegianOkinawanOsageOttawaPaiutePakistaniPalestinianPanamanianParaguayanPennsylvania GermanPeruvianPimaPolishPortuguesePotawatomiPuebloPuerto RicanPuget Sound SalishRomanianRussianSalvadoranSamoanScandinavianScotch-IrishScottishSeminoleSenegaleseSerbianShoshoneSierra LeoneanSiouxSlavicSlovakSloveneSomaliSouth AfricanSouth AmericanSouth American IndianSoviet UnionSpaniardSpanishSpanish AmericanSpanish American IndianSri LankanSubsaharan AfricanSudaneseSwedishSwissSyrianTaiwaneseThaiTlingit-HaidaTohono O'OdhamTonganTrinidadian and TobagonianTsimshianTurkishU.S. Virgin IslanderUgandanUkrainianUruguayanUteVenezuelanVietnameseWelshWest IndianYakamaYaquiYugoslavianYumanYup'ikZimbabwean
Immigration
NonimmigrantsImmigrantsAfghanistanAfricaAlbaniaArgentinaArmeniaAsiaAustraliaAustriaBahamasBangladeshBarbadosBelarusBelgiumBelizeBoliviaBosnia and HerzegovinaBrazilBulgariaBurma/MyanmarCabo VerdeCambodiaCameroonCanadaCaribbeanCentral AmericaChileChinaColombiaCongoCosta RicaCroatiaCubaCzechoslovakiaDenmarkDominicaDominican RepublicEastern AfricaEastern AsiaEastern EuropeEcuadorEgyptEl SalvadorEnglandEritreaEthiopiaEuropeFijiFranceGermanyGhanaGreeceGrenadaGuatemalaGuyanaHaitiHondurasHong KongHungaryIndiaIndonesiaIranIraqIrelandIsraelItalyJamaicaJapanJordanKazakhstanKenyaKoreaKuwaitLaosLatin AmericaLatviaLebanonLiberiaLithuaniaMalaysiaMexicoMicronesiaMiddle AfricaMoldovaMoroccoNepalNetherlandsNicaraguaNigeriaNorth AmericaNorth MacedoniaNorthern AfricaNorthern EuropeNorwayOceaniaPakistanPanamaPeruPhilippinesPolandPortugalRomaniaRussiaSaudi ArabiaScotlandSenegalSerbiaSierra LeoneSingaporeSomaliaSouth AfricaSouth AmericaSouth Central AsiaSouth Eastern AsiaSouthern EuropeSpainSri LankaSt. Vincent and the GrenadinesSudanSwedenSwitzerlandSyriaTaiwanThailandTrinidad and TobagoTurkeyUgandaUkraineUruguayUzbekistanVenezuelaVietnamWest IndiesWestern AfricaWestern AsiaWestern EuropeYemenZaireZimbabweAzores
Child Poverty Among Boys Under 16
Income
Poverty
Unemployment
Labor Participation
Family Structure
Vehicle Availability
Education Level
Disability

Child Poverty Among Boys Under 16 Comparison

Aleuts

Guyanese

Tragic
Tragic
17.7%
CHILD POVERTY AMONG BOYS UNDER 16
6.6/ 100
METRIC RATING
212th/ 347
METRIC RANK
19.6%
CHILD POVERTY AMONG BOYS UNDER 16
0.1/ 100
METRIC RATING
265th/ 347
METRIC RANK

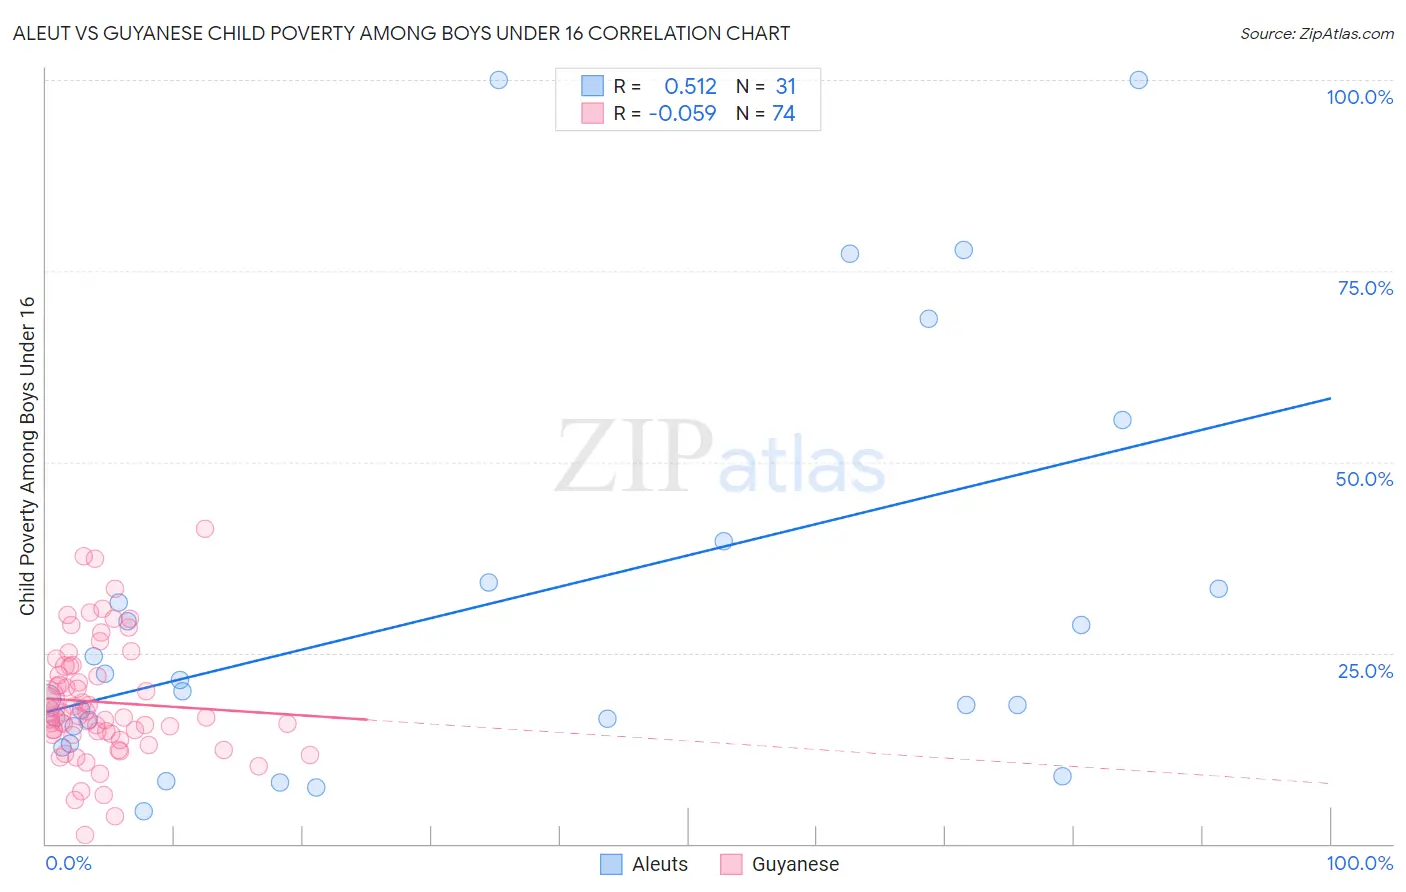
Aleut vs Guyanese Child Poverty Among Boys Under 16 Correlation Chart

The statistical analysis conducted on geographies consisting of 61,373,672 people shows a substantial positive correlation between the proportion of Aleuts and poverty level among boys under the age of 16 in the United States with a correlation coefficient (R) of 0.512 and weighted average of 17.7%. Similarly, the statistical analysis conducted on geographies consisting of 175,314,590 people shows a slight negative correlation between the proportion of Guyanese and poverty level among boys under the age of 16 in the United States with a correlation coefficient (R) of -0.059 and weighted average of 19.6%, a difference of 11.0%.
Aleut vs Guyanese Child Poverty Among Boys Under 16

Child Poverty Among Boys Under 16 Correlation Summary

MeasurementAleutGuyanese
Minimum4.2%1.2%
Maximum100.0%41.2%
Range95.8%39.9%
Mean31.1%18.6%
Median20.0%16.6%
Interquartile 25% (IQ1)15.3%14.3%
Interquartile 75% (IQ3)34.3%23.3%
Interquartile Range (IQR)19.0%9.0%
Standard Deviation (Sample)26.7%7.8%
Standard Deviation (Population)26.2%7.8%

Similar Demographics by Child Poverty Among Boys Under 16

Demographics Similar to Aleuts by Child Poverty Among Boys Under 16

In terms of child poverty among boys under 16, the demographic groups most similar to Aleuts are Immigrants (17.6%, a difference of 0.050%), Immigrants from Armenia (17.6%, a difference of 0.11%), Immigrants from Eastern Africa (17.7%, a difference of 0.28%), Panamanian (17.7%, a difference of 0.28%), and Alaskan Athabascan (17.6%, a difference of 0.29%).
DemographicsRating | RankChild Poverty Among Boys Under 16
Immigrants | Portugal
11.2
/100
|
#205
Poor
17.4%
German Russians
10.9
/100
|
#206
Poor
17.4%
Immigrants | Thailand
8.2
/100
|
#207
Tragic
17.5%
Malaysians
7.6
/100
|
#208
Tragic
17.6%
Alaskan Athabascans
7.3
/100
|
#209
Tragic
17.6%
Immigrants | Armenia
6.8
/100
|
#210
Tragic
17.6%
Immigrants | Immigrants
6.7
/100
|
#211
Tragic
17.6%
Aleuts
6.6
/100
|
#212
Tragic
17.7%
Immigrants | Eastern Africa
6.0
/100
|
#213
Tragic
17.7%
Panamanians
5.9
/100
|
#214
Tragic
17.7%
Osage
5.8
/100
|
#215
Tragic
17.7%
Moroccans
5.6
/100
|
#216
Tragic
17.7%
Japanese
5.5
/100
|
#217
Tragic
17.7%
Iraqis
5.5
/100
|
#218
Tragic
17.7%
Sierra Leoneans
5.3
/100
|
#219
Tragic
17.8%

Demographics Similar to Guyanese by Child Poverty Among Boys Under 16

In terms of child poverty among boys under 16, the demographic groups most similar to Guyanese are Immigrants from El Salvador (19.6%, a difference of 0.040%), Vietnamese (19.6%, a difference of 0.060%), Iroquois (19.6%, a difference of 0.090%), Spanish American Indian (19.6%, a difference of 0.17%), and Ottawa (19.5%, a difference of 0.32%).
DemographicsRating | RankChild Poverty Among Boys Under 16
Potawatomi
0.2
/100
|
#258
Tragic
19.4%
Spanish Americans
0.2
/100
|
#259
Tragic
19.4%
Shoshone
0.2
/100
|
#260
Tragic
19.4%
Immigrants | Ghana
0.2
/100
|
#261
Tragic
19.4%
Immigrants | Guyana
0.1
/100
|
#262
Tragic
19.5%
Ottawa
0.1
/100
|
#263
Tragic
19.5%
Iroquois
0.1
/100
|
#264
Tragic
19.6%
Guyanese
0.1
/100
|
#265
Tragic
19.6%
Immigrants | El Salvador
0.1
/100
|
#266
Tragic
19.6%
Vietnamese
0.1
/100
|
#267
Tragic
19.6%
Spanish American Indians
0.1
/100
|
#268
Tragic
19.6%
Immigrants | Cabo Verde
0.1
/100
|
#269
Tragic
19.7%
Cherokee
0.1
/100
|
#270
Tragic
19.7%
Chickasaw
0.1
/100
|
#271
Tragic
19.8%
Immigrants | Ecuador
0.1
/100
|
#272
Tragic
19.8%