Spanish American vs Welsh Child Poverty Under the Age of 5
COMPARE
Spanish American
Welsh
Child Poverty Under the Age of 5
Child Poverty Under the Age of 5 Comparison
Spanish Americans
Welsh
20.1%
CHILD POVERTY UNDER THE AGE OF 5
0.2/ 100
METRIC RATING
260th/ 347
METRIC RANK
17.2%
CHILD POVERTY UNDER THE AGE OF 5
54.0/ 100
METRIC RATING
173rd/ 347
METRIC RANK
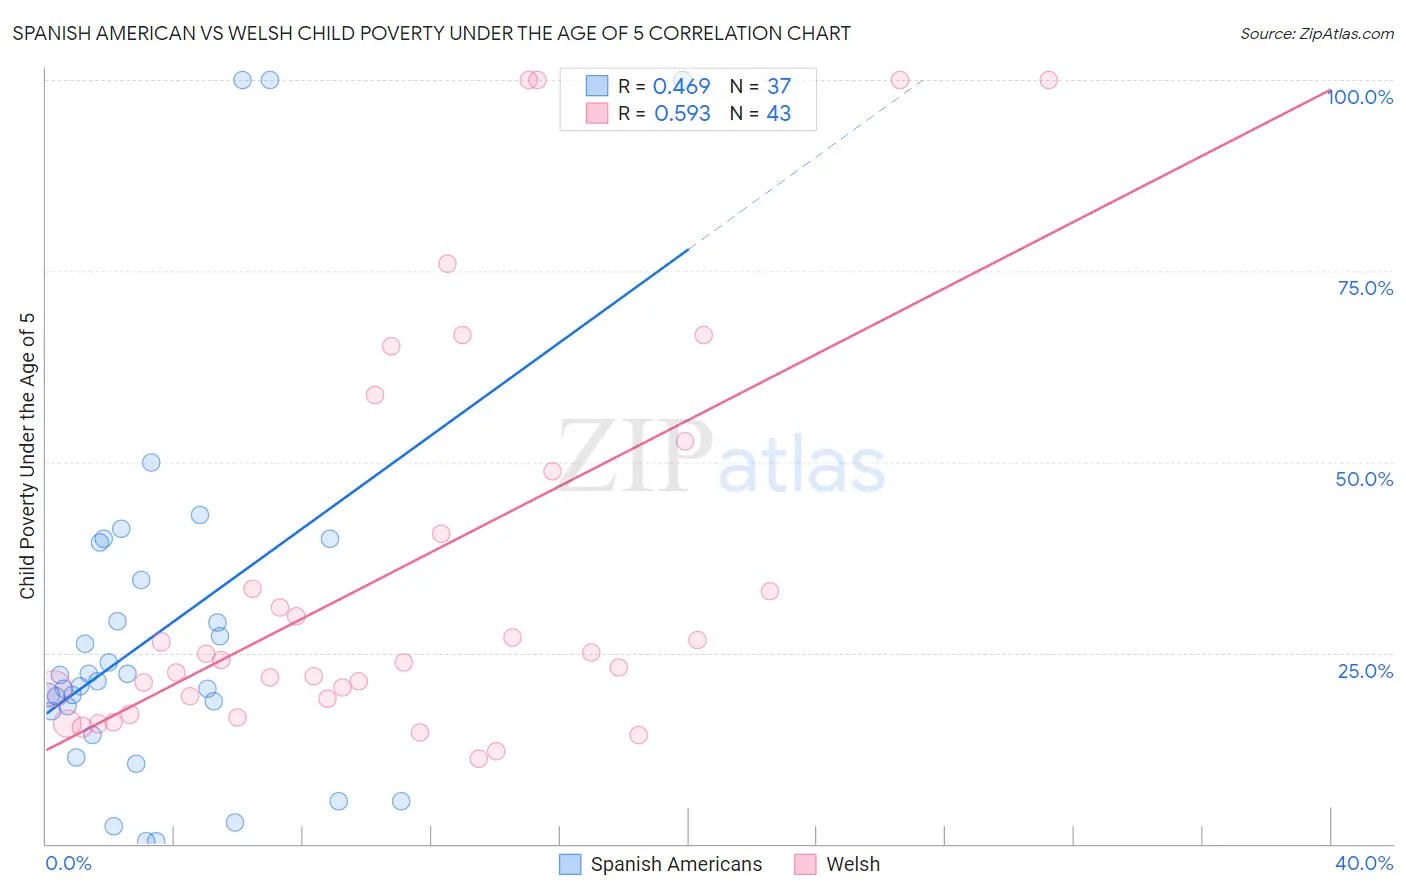
Spanish American vs Welsh Child Poverty Under the Age of 5 Correlation Chart
The statistical analysis conducted on geographies consisting of 102,323,940 people shows a moderate positive correlation between the proportion of Spanish Americans and poverty level among children under the age of 5 in the United States with a correlation coefficient (R) of 0.469 and weighted average of 20.1%. Similarly, the statistical analysis conducted on geographies consisting of 495,489,494 people shows a substantial positive correlation between the proportion of Welsh and poverty level among children under the age of 5 in the United States with a correlation coefficient (R) of 0.593 and weighted average of 17.2%, a difference of 17.0%.
Child Poverty Under the Age of 5 Correlation Summary
| Measurement | Spanish American | Welsh |
| Minimum | 0.35% | 11.2% |
| Maximum | 100.0% | 100.0% |
| Range | 99.6% | 88.8% |
| Mean | 28.1% | 35.8% |
| Median | 21.3% | 24.0% |
| Interquartile 25% (IQ1) | 15.8% | 19.0% |
| Interquartile 75% (IQ3) | 37.0% | 48.8% |
| Interquartile Range (IQR) | 21.1% | 29.8% |
| Standard Deviation (Sample) | 24.9% | 26.4% |
| Standard Deviation (Population) | 24.6% | 26.1% |
Similar Demographics by Child Poverty Under the Age of 5
Demographics Similar to Spanish Americans by Child Poverty Under the Age of 5
In terms of child poverty under the age of 5, the demographic groups most similar to Spanish Americans are Immigrants from Bangladesh (20.1%, a difference of 0.040%), Immigrants from El Salvador (20.0%, a difference of 0.40%), Immigrants from St. Vincent and the Grenadines (20.0%, a difference of 0.43%), Liberian (20.2%, a difference of 0.45%), and Barbadian (20.2%, a difference of 0.51%).
| Demographics | Rating | Rank | Child Poverty Under the Age of 5 |
| Mexican American Indians | 0.3 /100 | #253 | Tragic 19.9% |
| Fijians | 0.3 /100 | #254 | Tragic 19.9% |
| Immigrants | Cuba | 0.2 /100 | #255 | Tragic 19.9% |
| Immigrants | Barbados | 0.2 /100 | #256 | Tragic 20.0% |
| Shoshone | 0.2 /100 | #257 | Tragic 20.0% |
| Immigrants | St. Vincent and the Grenadines | 0.2 /100 | #258 | Tragic 20.0% |
| Immigrants | El Salvador | 0.2 /100 | #259 | Tragic 20.0% |
| Spanish Americans | 0.2 /100 | #260 | Tragic 20.1% |
| Immigrants | Bangladesh | 0.2 /100 | #261 | Tragic 20.1% |
| Liberians | 0.1 /100 | #262 | Tragic 20.2% |
| Barbadians | 0.1 /100 | #263 | Tragic 20.2% |
| Immigrants | Liberia | 0.1 /100 | #264 | Tragic 20.2% |
| Spanish American Indians | 0.1 /100 | #265 | Tragic 20.2% |
| Aleuts | 0.1 /100 | #266 | Tragic 20.3% |
| Ottawa | 0.1 /100 | #267 | Tragic 20.3% |
Demographics Similar to Welsh by Child Poverty Under the Age of 5
In terms of child poverty under the age of 5, the demographic groups most similar to Welsh are Yugoslavian (17.2%, a difference of 0.010%), Immigrants from Saudi Arabia (17.2%, a difference of 0.42%), Immigrants from Morocco (17.1%, a difference of 0.53%), Immigrants from Western Asia (17.1%, a difference of 0.56%), and Immigrants from South America (17.1%, a difference of 0.65%).
| Demographics | Rating | Rank | Child Poverty Under the Age of 5 |
| Slavs | 64.0 /100 | #166 | Good 17.0% |
| Immigrants | Uzbekistan | 62.0 /100 | #167 | Good 17.0% |
| Uruguayans | 60.5 /100 | #168 | Good 17.0% |
| Immigrants | South America | 60.0 /100 | #169 | Good 17.1% |
| Immigrants | Western Asia | 59.2 /100 | #170 | Average 17.1% |
| Immigrants | Morocco | 58.9 /100 | #171 | Average 17.1% |
| Yugoslavians | 54.1 /100 | #172 | Average 17.2% |
| Welsh | 54.0 /100 | #173 | Average 17.2% |
| Immigrants | Saudi Arabia | 50.0 /100 | #174 | Average 17.2% |
| Immigrants | Lebanon | 47.6 /100 | #175 | Average 17.3% |
| Immigrants | Iraq | 45.2 /100 | #176 | Average 17.3% |
| Immigrants | Sierra Leone | 43.6 /100 | #177 | Average 17.3% |
| Immigrants | Cameroon | 42.7 /100 | #178 | Average 17.4% |
| Hawaiians | 41.5 /100 | #179 | Average 17.4% |
| South American Indians | 41.4 /100 | #180 | Average 17.4% |