Albanian vs Hungarian Single Mother Households
COMPARE
Albanian
Hungarian
Single Mother Households
Single Mother Households Comparison
Albanians
Hungarians
5.9%
SINGLE MOTHER HOUSEHOLDS
91.1/ 100
METRIC RATING
132nd/ 347
METRIC RANK
5.7%
SINGLE MOTHER HOUSEHOLDS
97.6/ 100
METRIC RATING
85th/ 347
METRIC RANK
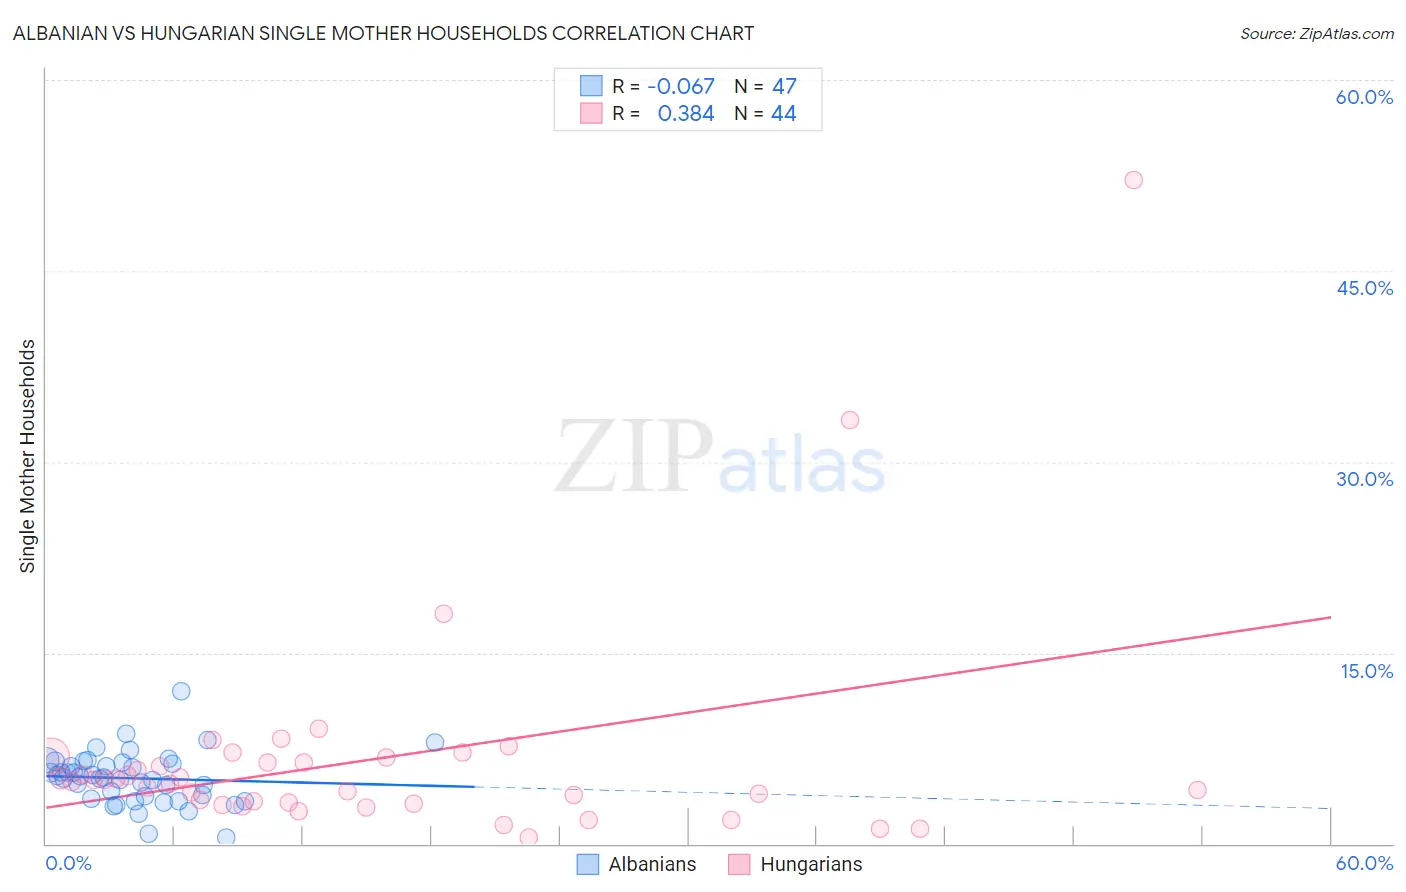
Albanian vs Hungarian Single Mother Households Correlation Chart
The statistical analysis conducted on geographies consisting of 193,011,993 people shows a slight negative correlation between the proportion of Albanians and percentage of single mother households in the United States with a correlation coefficient (R) of -0.067 and weighted average of 5.9%. Similarly, the statistical analysis conducted on geographies consisting of 483,597,168 people shows a mild positive correlation between the proportion of Hungarians and percentage of single mother households in the United States with a correlation coefficient (R) of 0.384 and weighted average of 5.7%, a difference of 4.2%.
Single Mother Households Correlation Summary
| Measurement | Albanian | Hungarian |
| Minimum | 0.45% | 0.48% |
| Maximum | 12.0% | 52.2% |
| Range | 11.6% | 51.7% |
| Mean | 5.1% | 6.6% |
| Median | 5.2% | 4.9% |
| Interquartile 25% (IQ1) | 3.5% | 3.2% |
| Interquartile 75% (IQ3) | 6.4% | 6.6% |
| Interquartile Range (IQR) | 2.9% | 3.4% |
| Standard Deviation (Sample) | 2.1% | 8.7% |
| Standard Deviation (Population) | 2.0% | 8.6% |
Similar Demographics by Single Mother Households
Demographics Similar to Albanians by Single Mother Households
In terms of single mother households, the demographic groups most similar to Albanians are Immigrants from Spain (5.9%, a difference of 0.040%), Egyptian (5.9%, a difference of 0.15%), Canadian (5.9%, a difference of 0.22%), Immigrants from Saudi Arabia (5.9%, a difference of 0.31%), and Palestinian (5.9%, a difference of 0.39%).
| Demographics | Rating | Rank | Single Mother Households |
| Slavs | 92.9 /100 | #125 | Exceptional 5.9% |
| Welsh | 92.8 /100 | #126 | Exceptional 5.9% |
| Lebanese | 92.4 /100 | #127 | Exceptional 5.9% |
| Czechoslovakians | 92.2 /100 | #128 | Exceptional 5.9% |
| Immigrants | Bolivia | 92.2 /100 | #129 | Exceptional 5.9% |
| Palestinians | 92.1 /100 | #130 | Exceptional 5.9% |
| Immigrants | Spain | 91.2 /100 | #131 | Exceptional 5.9% |
| Albanians | 91.1 /100 | #132 | Exceptional 5.9% |
| Egyptians | 90.7 /100 | #133 | Exceptional 5.9% |
| Canadians | 90.5 /100 | #134 | Exceptional 5.9% |
| Immigrants | Saudi Arabia | 90.2 /100 | #135 | Exceptional 5.9% |
| Jordanians | 88.9 /100 | #136 | Excellent 6.0% |
| Immigrants | Pakistan | 88.4 /100 | #137 | Excellent 6.0% |
| Icelanders | 86.9 /100 | #138 | Excellent 6.0% |
| Syrians | 86.0 /100 | #139 | Excellent 6.0% |
Demographics Similar to Hungarians by Single Mother Households
In terms of single mother households, the demographic groups most similar to Hungarians are Finnish (5.7%, a difference of 0.030%), Immigrants from Turkey (5.7%, a difference of 0.11%), Carpatho Rusyn (5.7%, a difference of 0.15%), Israeli (5.7%, a difference of 0.18%), and Immigrants from Hungary (5.7%, a difference of 0.23%).
| Demographics | Rating | Rank | Single Mother Households |
| Swiss | 98.1 /100 | #78 | Exceptional 5.6% |
| Immigrants | Sri Lanka | 98.0 /100 | #79 | Exceptional 5.6% |
| Czechs | 97.9 /100 | #80 | Exceptional 5.6% |
| Immigrants | Moldova | 97.9 /100 | #81 | Exceptional 5.6% |
| Immigrants | Malaysia | 97.8 /100 | #82 | Exceptional 5.7% |
| Immigrants | Hungary | 97.8 /100 | #83 | Exceptional 5.7% |
| Carpatho Rusyns | 97.7 /100 | #84 | Exceptional 5.7% |
| Hungarians | 97.6 /100 | #85 | Exceptional 5.7% |
| Finns | 97.6 /100 | #86 | Exceptional 5.7% |
| Immigrants | Turkey | 97.5 /100 | #87 | Exceptional 5.7% |
| Israelis | 97.4 /100 | #88 | Exceptional 5.7% |
| Ukrainians | 97.2 /100 | #89 | Exceptional 5.7% |
| Immigrants | Indonesia | 97.2 /100 | #90 | Exceptional 5.7% |
| Europeans | 97.0 /100 | #91 | Exceptional 5.7% |
| Immigrants | Western Asia | 96.7 /100 | #92 | Exceptional 5.7% |