Iranian vs Hungarian Seniors Poverty Over the Age of 65
COMPARE
Iranian
Hungarian
Seniors Poverty Over the Age of 65
Seniors Poverty Over the Age of 65 Comparison
Iranians
Hungarians
9.8%
SENIORS POVERTY OVER THE AGE OF 65
98.9/ 100
METRIC RATING
61st/ 347
METRIC RANK
9.7%
SENIORS POVERTY OVER THE AGE OF 65
99.4/ 100
METRIC RATING
50th/ 347
METRIC RANK
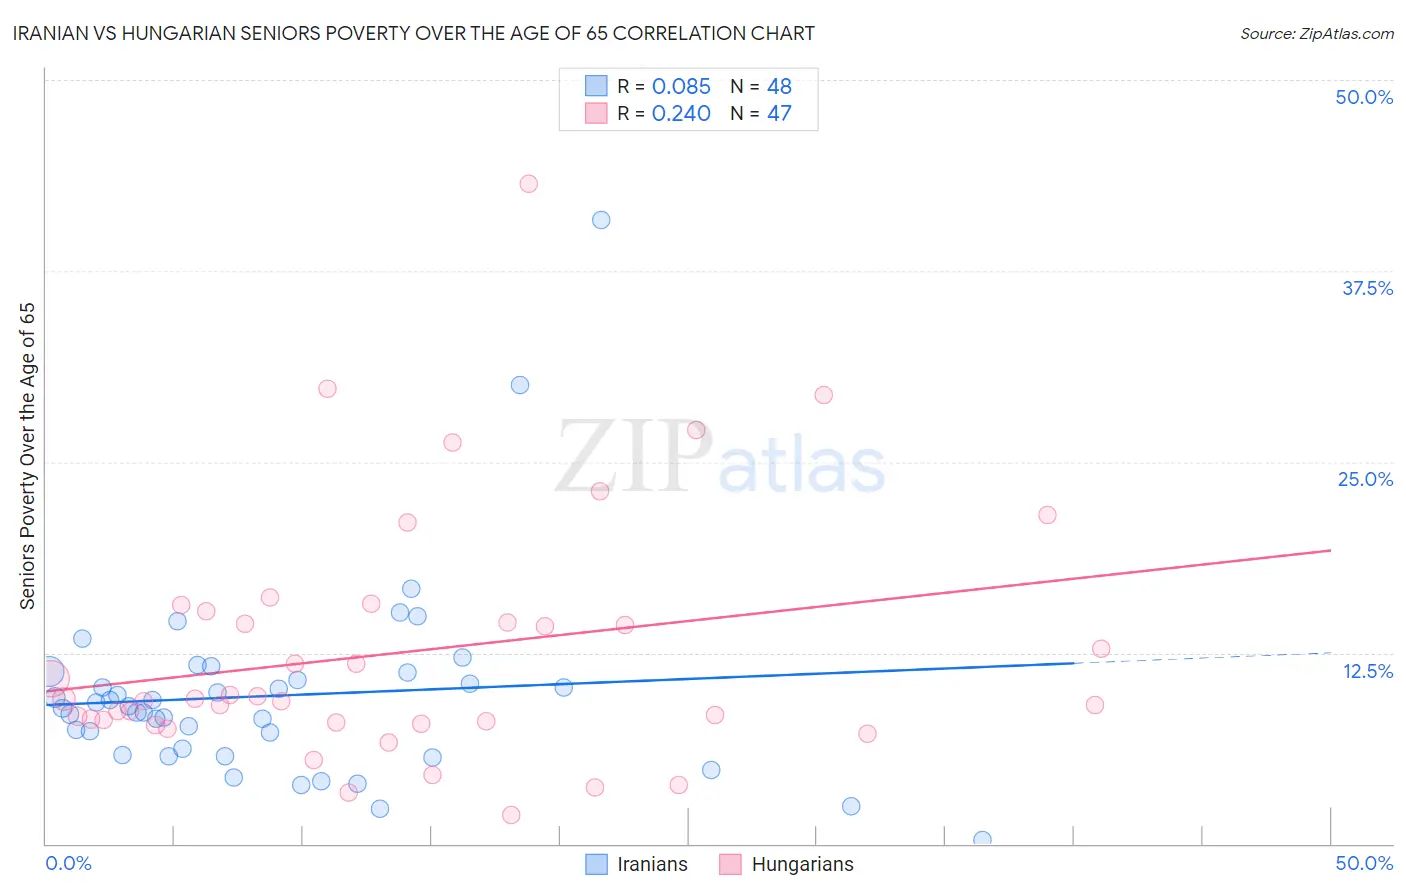
Iranian vs Hungarian Seniors Poverty Over the Age of 65 Correlation Chart
The statistical analysis conducted on geographies consisting of 315,982,705 people shows a slight positive correlation between the proportion of Iranians and poverty level among seniors over the age of 65 in the United States with a correlation coefficient (R) of 0.085 and weighted average of 9.8%. Similarly, the statistical analysis conducted on geographies consisting of 483,559,616 people shows a weak positive correlation between the proportion of Hungarians and poverty level among seniors over the age of 65 in the United States with a correlation coefficient (R) of 0.240 and weighted average of 9.7%, a difference of 1.4%.
Seniors Poverty Over the Age of 65 Correlation Summary
| Measurement | Iranian | Hungarian |
| Minimum | 0.21% | 1.9% |
| Maximum | 40.9% | 43.2% |
| Range | 40.7% | 41.3% |
| Mean | 9.7% | 12.6% |
| Median | 8.9% | 9.5% |
| Interquartile 25% (IQ1) | 6.0% | 7.9% |
| Interquartile 75% (IQ3) | 10.9% | 15.2% |
| Interquartile Range (IQR) | 5.0% | 7.3% |
| Standard Deviation (Sample) | 6.5% | 8.2% |
| Standard Deviation (Population) | 6.5% | 8.1% |
Demographics Similar to Iranians and Hungarians by Seniors Poverty Over the Age of 65
In terms of seniors poverty over the age of 65, the demographic groups most similar to Iranians are French Canadian (9.8%, a difference of 0.040%), Celtic (9.8%, a difference of 0.080%), Immigrants from Canada (9.8%, a difference of 0.11%), Macedonian (9.9%, a difference of 0.22%), and Serbian (9.8%, a difference of 0.27%). Similarly, the demographic groups most similar to Hungarians are Immigrants from Lithuania (9.7%, a difference of 0.22%), French (9.7%, a difference of 0.28%), Immigrants from South Central Asia (9.7%, a difference of 0.39%), Immigrants from Taiwan (9.7%, a difference of 0.40%), and Carpatho Rusyn (9.7%, a difference of 0.48%).
| Demographics | Rating | Rank | Seniors Poverty Over the Age of 65 |
| Estonians | 99.5 /100 | #45 | Exceptional 9.6% |
| Immigrants | Taiwan | 99.5 /100 | #46 | Exceptional 9.7% |
| Immigrants | South Central Asia | 99.5 /100 | #47 | Exceptional 9.7% |
| French | 99.5 /100 | #48 | Exceptional 9.7% |
| Immigrants | Lithuania | 99.4 /100 | #49 | Exceptional 9.7% |
| Hungarians | 99.4 /100 | #50 | Exceptional 9.7% |
| Carpatho Rusyns | 99.3 /100 | #51 | Exceptional 9.7% |
| Filipinos | 99.3 /100 | #52 | Exceptional 9.7% |
| Slavs | 99.2 /100 | #53 | Exceptional 9.8% |
| Immigrants | Northern Europe | 99.2 /100 | #54 | Exceptional 9.8% |
| Afghans | 99.2 /100 | #55 | Exceptional 9.8% |
| Immigrants | England | 99.1 /100 | #56 | Exceptional 9.8% |
| Bolivians | 99.1 /100 | #57 | Exceptional 9.8% |
| Serbians | 99.1 /100 | #58 | Exceptional 9.8% |
| Immigrants | Canada | 99.0 /100 | #59 | Exceptional 9.8% |
| Celtics | 99.0 /100 | #60 | Exceptional 9.8% |
| Iranians | 98.9 /100 | #61 | Exceptional 9.8% |
| French Canadians | 98.9 /100 | #62 | Exceptional 9.8% |
| Macedonians | 98.8 /100 | #63 | Exceptional 9.9% |
| Immigrants | North America | 98.8 /100 | #64 | Exceptional 9.9% |
| Pennsylvania Germans | 98.7 /100 | #65 | Exceptional 9.9% |