Albanian vs Apache 2nd Grade
COMPARE
Albanian
Apache
2nd Grade
2nd Grade Comparison
Albanians
Apache
97.9%
2ND GRADE
52.8/ 100
METRIC RATING
171st/ 347
METRIC RANK
97.9%
2ND GRADE
74.0/ 100
METRIC RATING
149th/ 347
METRIC RANK
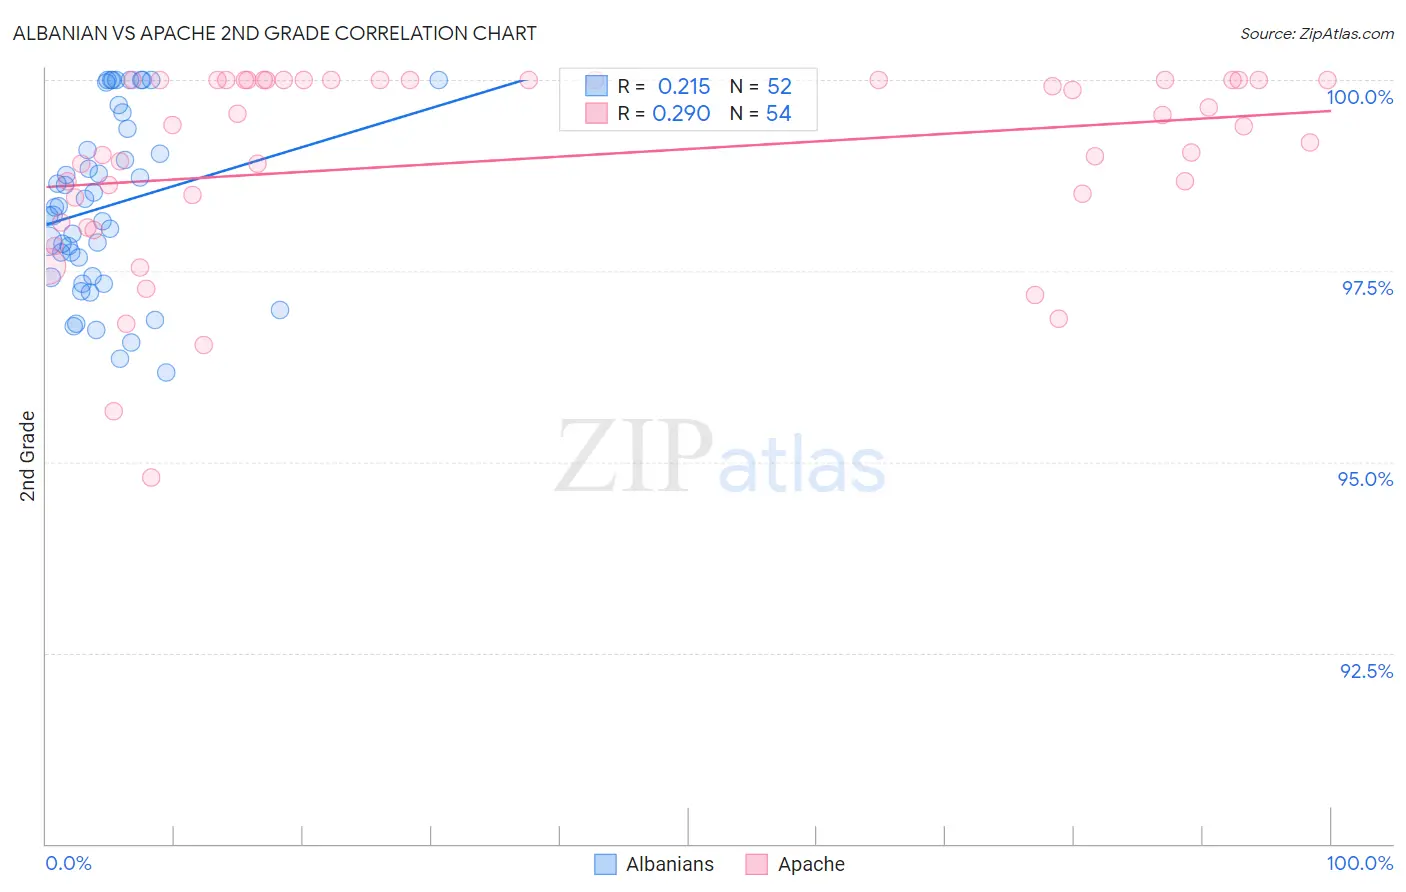
Albanian vs Apache 2nd Grade Correlation Chart
The statistical analysis conducted on geographies consisting of 193,265,850 people shows a weak positive correlation between the proportion of Albanians and percentage of population with at least 2nd grade education in the United States with a correlation coefficient (R) of 0.215 and weighted average of 97.9%. Similarly, the statistical analysis conducted on geographies consisting of 231,142,814 people shows a weak positive correlation between the proportion of Apache and percentage of population with at least 2nd grade education in the United States with a correlation coefficient (R) of 0.290 and weighted average of 97.9%, a difference of 0.070%.
2nd Grade Correlation Summary
| Measurement | Albanian | Apache |
| Minimum | 96.2% | 94.8% |
| Maximum | 100.0% | 100.0% |
| Range | 3.8% | 5.2% |
| Mean | 98.3% | 99.0% |
| Median | 98.3% | 99.4% |
| Interquartile 25% (IQ1) | 97.4% | 98.5% |
| Interquartile 75% (IQ3) | 99.2% | 100.0% |
| Interquartile Range (IQR) | 1.8% | 1.5% |
| Standard Deviation (Sample) | 1.1% | 1.3% |
| Standard Deviation (Population) | 1.1% | 1.2% |
Similar Demographics by 2nd Grade
Demographics Similar to Albanians by 2nd Grade
In terms of 2nd grade, the demographic groups most similar to Albanians are Navajo (97.9%, a difference of 0.0%), Immigrants from Korea (97.9%, a difference of 0.0%), Kenyan (97.9%, a difference of 0.0%), Ugandan (97.9%, a difference of 0.010%), and Spanish American (97.9%, a difference of 0.010%).
| Demographics | Rating | Rank | 2nd Grade |
| Ugandans | 56.6 /100 | #164 | Average 97.9% |
| Spanish Americans | 56.4 /100 | #165 | Average 97.9% |
| Immigrants | Jordan | 56.3 /100 | #166 | Average 97.9% |
| Chileans | 56.1 /100 | #167 | Average 97.9% |
| Brazilians | 55.8 /100 | #168 | Average 97.9% |
| Immigrants | Spain | 55.4 /100 | #169 | Average 97.9% |
| Navajo | 54.3 /100 | #170 | Average 97.9% |
| Albanians | 52.8 /100 | #171 | Average 97.9% |
| Immigrants | Korea | 52.7 /100 | #172 | Average 97.9% |
| Kenyans | 52.7 /100 | #173 | Average 97.9% |
| Immigrants | Micronesia | 50.0 /100 | #174 | Average 97.9% |
| Immigrants | Bosnia and Herzegovina | 49.8 /100 | #175 | Average 97.9% |
| Immigrants | Sri Lanka | 48.7 /100 | #176 | Average 97.9% |
| Immigrants | Brazil | 46.6 /100 | #177 | Average 97.9% |
| Argentineans | 46.3 /100 | #178 | Average 97.9% |
Demographics Similar to Apache by 2nd Grade
In terms of 2nd grade, the demographic groups most similar to Apache are Jordanian (98.0%, a difference of 0.0%), Immigrants from Moldova (97.9%, a difference of 0.0%), Immigrants from Greece (98.0%, a difference of 0.010%), Soviet Union (97.9%, a difference of 0.010%), and Filipino (98.0%, a difference of 0.020%).
| Demographics | Rating | Rank | 2nd Grade |
| Burmese | 81.0 /100 | #142 | Excellent 98.0% |
| Alsatians | 80.5 /100 | #143 | Excellent 98.0% |
| Hmong | 80.0 /100 | #144 | Good 98.0% |
| Filipinos | 79.2 /100 | #145 | Good 98.0% |
| Immigrants | Israel | 78.0 /100 | #146 | Good 98.0% |
| Immigrants | Greece | 76.8 /100 | #147 | Good 98.0% |
| Jordanians | 74.5 /100 | #148 | Good 98.0% |
| Apache | 74.0 /100 | #149 | Good 97.9% |
| Immigrants | Moldova | 72.9 /100 | #150 | Good 97.9% |
| Soviet Union | 70.7 /100 | #151 | Good 97.9% |
| Immigrants | North Macedonia | 68.5 /100 | #152 | Good 97.9% |
| Immigrants | South Central Asia | 68.3 /100 | #153 | Good 97.9% |
| Marshallese | 67.7 /100 | #154 | Good 97.9% |
| French American Indians | 64.3 /100 | #155 | Good 97.9% |
| Dutch West Indians | 63.8 /100 | #156 | Good 97.9% |