Immigrants from Jordan vs Nonimmigrants Child Poverty Under the Age of 16
COMPARE
Immigrants from Jordan
Nonimmigrants
Child Poverty Under the Age of 16
Child Poverty Under the Age of 16 Comparison
Immigrants from Jordan
Nonimmigrants
15.6%
CHILD POVERTY UNDER THE AGE OF 16
78.5/ 100
METRIC RATING
150th/ 347
METRIC RANK
17.9%
CHILD POVERTY UNDER THE AGE OF 16
2.7/ 100
METRIC RATING
225th/ 347
METRIC RANK
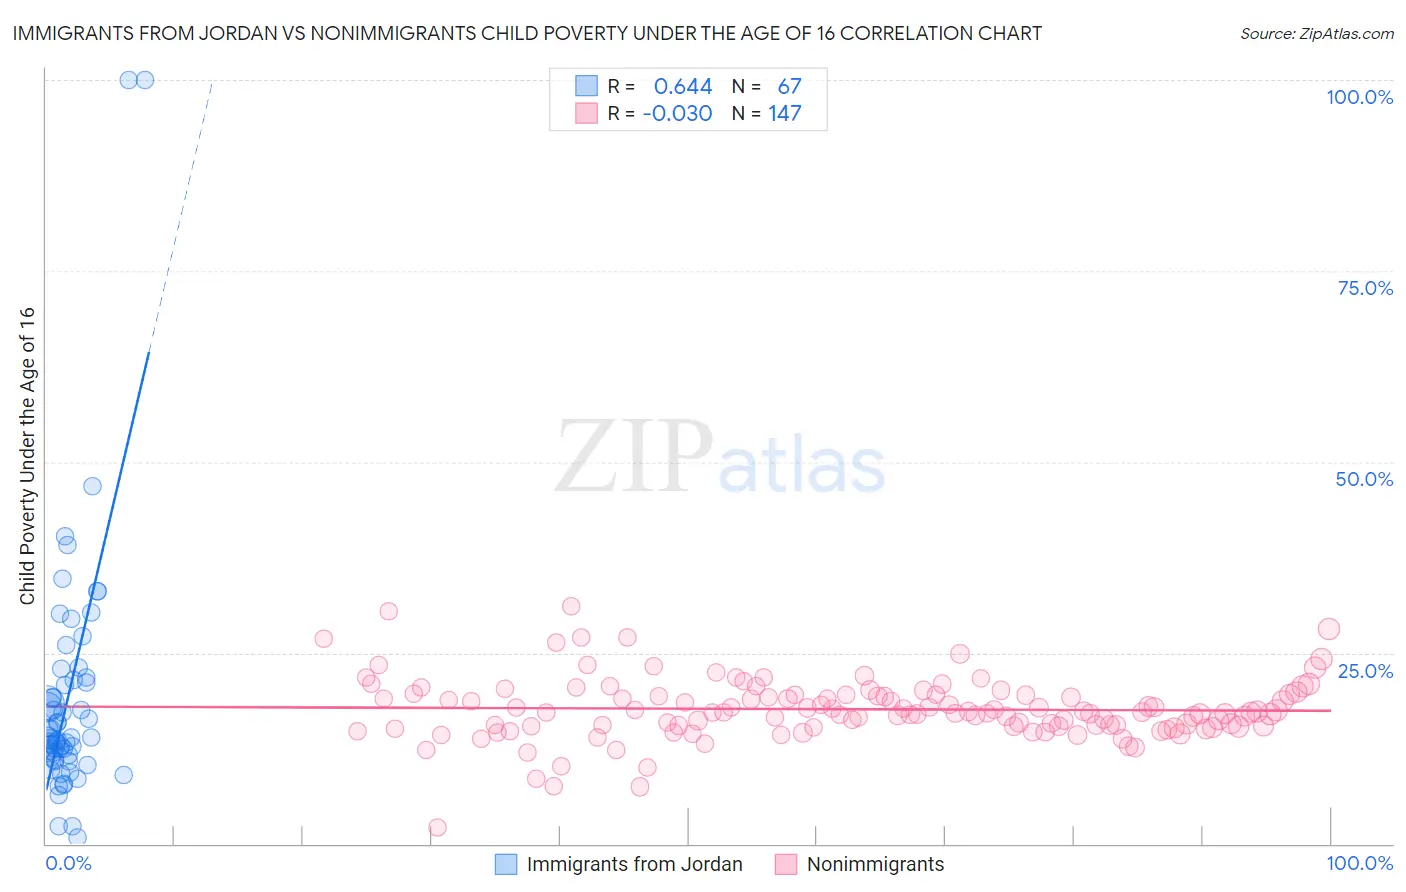
Immigrants from Jordan vs Nonimmigrants Child Poverty Under the Age of 16 Correlation Chart
The statistical analysis conducted on geographies consisting of 180,809,646 people shows a significant positive correlation between the proportion of Immigrants from Jordan and poverty level among children under the age of 16 in the United States with a correlation coefficient (R) of 0.644 and weighted average of 15.6%. Similarly, the statistical analysis conducted on geographies consisting of 569,879,653 people shows no correlation between the proportion of Nonimmigrants and poverty level among children under the age of 16 in the United States with a correlation coefficient (R) of -0.030 and weighted average of 17.9%, a difference of 15.2%.
Child Poverty Under the Age of 16 Correlation Summary
| Measurement | Immigrants from Jordan | Nonimmigrants |
| Minimum | 0.79% | 2.1% |
| Maximum | 100.0% | 31.1% |
| Range | 99.2% | 29.0% |
| Mean | 19.2% | 17.6% |
| Median | 13.8% | 17.2% |
| Interquartile 25% (IQ1) | 11.3% | 15.4% |
| Interquartile 75% (IQ3) | 21.5% | 19.5% |
| Interquartile Range (IQR) | 10.2% | 4.2% |
| Standard Deviation (Sample) | 16.9% | 4.1% |
| Standard Deviation (Population) | 16.8% | 4.0% |
Similar Demographics by Child Poverty Under the Age of 16
Demographics Similar to Immigrants from Jordan by Child Poverty Under the Age of 16
In terms of child poverty under the age of 16, the demographic groups most similar to Immigrants from Jordan are French (15.6%, a difference of 0.0%), French Canadian (15.6%, a difference of 0.040%), Venezuelan (15.6%, a difference of 0.19%), Samoan (15.6%, a difference of 0.22%), and Israeli (15.5%, a difference of 0.32%).
| Demographics | Rating | Rank | Child Poverty Under the Age of 16 |
| Icelanders | 82.5 /100 | #143 | Excellent 15.4% |
| Immigrants | Hungary | 81.9 /100 | #144 | Excellent 15.5% |
| Immigrants | Peru | 81.7 /100 | #145 | Excellent 15.5% |
| Slovaks | 81.4 /100 | #146 | Excellent 15.5% |
| Immigrants | Kuwait | 80.5 /100 | #147 | Excellent 15.5% |
| Puget Sound Salish | 80.3 /100 | #148 | Excellent 15.5% |
| Israelis | 80.1 /100 | #149 | Excellent 15.5% |
| Immigrants | Jordan | 78.5 /100 | #150 | Good 15.6% |
| French | 78.5 /100 | #151 | Good 15.6% |
| French Canadians | 78.2 /100 | #152 | Good 15.6% |
| Venezuelans | 77.4 /100 | #153 | Good 15.6% |
| Samoans | 77.3 /100 | #154 | Good 15.6% |
| Syrians | 76.1 /100 | #155 | Good 15.6% |
| Immigrants | Venezuela | 74.9 /100 | #156 | Good 15.7% |
| Immigrants | Nepal | 72.9 /100 | #157 | Good 15.7% |
Demographics Similar to Nonimmigrants by Child Poverty Under the Age of 16
In terms of child poverty under the age of 16, the demographic groups most similar to Nonimmigrants are Bermudan (18.0%, a difference of 0.070%), Immigrants from Africa (18.0%, a difference of 0.25%), Osage (17.9%, a difference of 0.36%), Immigrants from Micronesia (18.0%, a difference of 0.40%), and Immigrants from Cambodia (17.8%, a difference of 0.60%).
| Demographics | Rating | Rank | Child Poverty Under the Age of 16 |
| Moroccans | 5.3 /100 | #218 | Tragic 17.6% |
| Japanese | 4.7 /100 | #219 | Tragic 17.7% |
| Immigrants | Panama | 4.1 /100 | #220 | Tragic 17.7% |
| Cubans | 3.7 /100 | #221 | Tragic 17.8% |
| Immigrants | Armenia | 3.6 /100 | #222 | Tragic 17.8% |
| Immigrants | Cambodia | 3.3 /100 | #223 | Tragic 17.8% |
| Osage | 3.1 /100 | #224 | Tragic 17.9% |
| Immigrants | Nonimmigrants | 2.7 /100 | #225 | Tragic 17.9% |
| Bermudans | 2.6 /100 | #226 | Tragic 18.0% |
| Immigrants | Africa | 2.5 /100 | #227 | Tragic 18.0% |
| Immigrants | Micronesia | 2.3 /100 | #228 | Tragic 18.0% |
| Marshallese | 1.8 /100 | #229 | Tragic 18.1% |
| Nepalese | 1.7 /100 | #230 | Tragic 18.2% |
| Nicaraguans | 1.7 /100 | #231 | Tragic 18.2% |
| Americans | 1.2 /100 | #232 | Tragic 18.3% |