Italian vs Nonimmigrants Child Poverty Under the Age of 16
COMPARE
Italian
Nonimmigrants
Child Poverty Under the Age of 16
Child Poverty Under the Age of 16 Comparison
Italians
Nonimmigrants
13.9%
CHILD POVERTY UNDER THE AGE OF 16
99.2/ 100
METRIC RATING
49th/ 347
METRIC RANK
17.9%
CHILD POVERTY UNDER THE AGE OF 16
2.7/ 100
METRIC RATING
225th/ 347
METRIC RANK
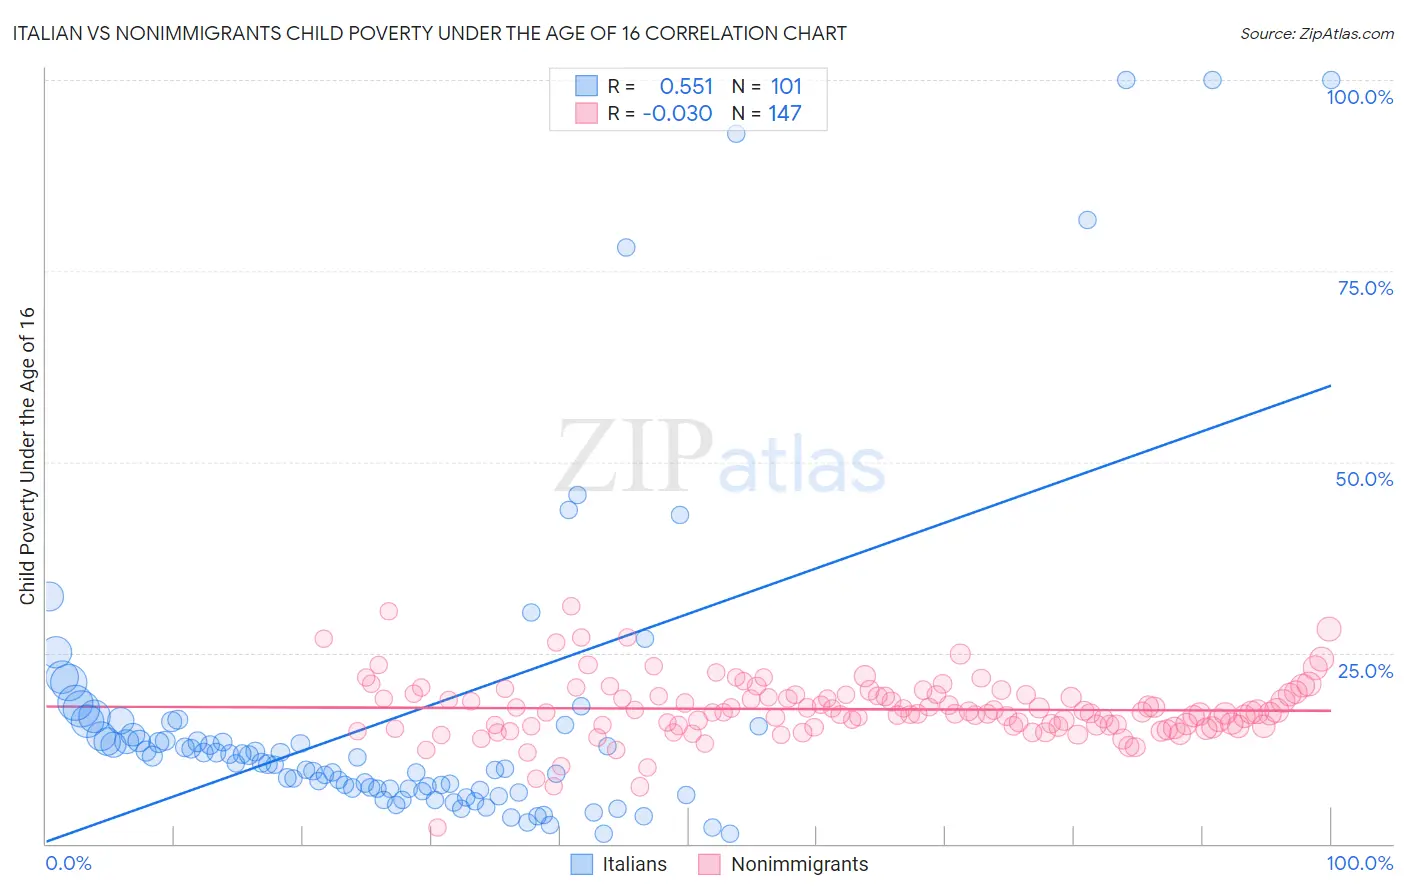
Italian vs Nonimmigrants Child Poverty Under the Age of 16 Correlation Chart
The statistical analysis conducted on geographies consisting of 561,533,046 people shows a substantial positive correlation between the proportion of Italians and poverty level among children under the age of 16 in the United States with a correlation coefficient (R) of 0.551 and weighted average of 13.9%. Similarly, the statistical analysis conducted on geographies consisting of 569,879,653 people shows no correlation between the proportion of Nonimmigrants and poverty level among children under the age of 16 in the United States with a correlation coefficient (R) of -0.030 and weighted average of 17.9%, a difference of 29.3%.
Child Poverty Under the Age of 16 Correlation Summary
| Measurement | Italian | Nonimmigrants |
| Minimum | 1.3% | 2.1% |
| Maximum | 100.0% | 31.1% |
| Range | 98.7% | 29.0% |
| Mean | 16.5% | 17.6% |
| Median | 10.6% | 17.2% |
| Interquartile 25% (IQ1) | 7.1% | 15.4% |
| Interquartile 75% (IQ3) | 14.8% | 19.5% |
| Interquartile Range (IQR) | 7.7% | 4.2% |
| Standard Deviation (Sample) | 20.8% | 4.1% |
| Standard Deviation (Population) | 20.7% | 4.0% |
Similar Demographics by Child Poverty Under the Age of 16
Demographics Similar to Italians by Child Poverty Under the Age of 16
In terms of child poverty under the age of 16, the demographic groups most similar to Italians are Korean (13.9%, a difference of 0.030%), Estonian (13.9%, a difference of 0.090%), Immigrants from Czechoslovakia (13.9%, a difference of 0.23%), Immigrants from Asia (13.8%, a difference of 0.25%), and Immigrants from Greece (13.9%, a difference of 0.35%).
| Demographics | Rating | Rank | Child Poverty Under the Age of 16 |
| Immigrants | Sri Lanka | 99.3 /100 | #42 | Exceptional 13.8% |
| Immigrants | Moldova | 99.3 /100 | #43 | Exceptional 13.8% |
| Greeks | 99.3 /100 | #44 | Exceptional 13.8% |
| Czechs | 99.3 /100 | #45 | Exceptional 13.8% |
| Immigrants | Asia | 99.2 /100 | #46 | Exceptional 13.8% |
| Estonians | 99.2 /100 | #47 | Exceptional 13.9% |
| Koreans | 99.2 /100 | #48 | Exceptional 13.9% |
| Italians | 99.2 /100 | #49 | Exceptional 13.9% |
| Immigrants | Czechoslovakia | 99.1 /100 | #50 | Exceptional 13.9% |
| Immigrants | Greece | 99.1 /100 | #51 | Exceptional 13.9% |
| Poles | 98.9 /100 | #52 | Exceptional 14.0% |
| Immigrants | Israel | 98.8 /100 | #53 | Exceptional 14.1% |
| Tsimshian | 98.8 /100 | #54 | Exceptional 14.1% |
| Immigrants | Indonesia | 98.7 /100 | #55 | Exceptional 14.1% |
| Immigrants | Serbia | 98.7 /100 | #56 | Exceptional 14.1% |
Demographics Similar to Nonimmigrants by Child Poverty Under the Age of 16
In terms of child poverty under the age of 16, the demographic groups most similar to Nonimmigrants are Bermudan (18.0%, a difference of 0.070%), Immigrants from Africa (18.0%, a difference of 0.25%), Osage (17.9%, a difference of 0.36%), Immigrants from Micronesia (18.0%, a difference of 0.40%), and Immigrants from Cambodia (17.8%, a difference of 0.60%).
| Demographics | Rating | Rank | Child Poverty Under the Age of 16 |
| Moroccans | 5.3 /100 | #218 | Tragic 17.6% |
| Japanese | 4.7 /100 | #219 | Tragic 17.7% |
| Immigrants | Panama | 4.1 /100 | #220 | Tragic 17.7% |
| Cubans | 3.7 /100 | #221 | Tragic 17.8% |
| Immigrants | Armenia | 3.6 /100 | #222 | Tragic 17.8% |
| Immigrants | Cambodia | 3.3 /100 | #223 | Tragic 17.8% |
| Osage | 3.1 /100 | #224 | Tragic 17.9% |
| Immigrants | Nonimmigrants | 2.7 /100 | #225 | Tragic 17.9% |
| Bermudans | 2.6 /100 | #226 | Tragic 18.0% |
| Immigrants | Africa | 2.5 /100 | #227 | Tragic 18.0% |
| Immigrants | Micronesia | 2.3 /100 | #228 | Tragic 18.0% |
| Marshallese | 1.8 /100 | #229 | Tragic 18.1% |
| Nepalese | 1.7 /100 | #230 | Tragic 18.2% |
| Nicaraguans | 1.7 /100 | #231 | Tragic 18.2% |
| Americans | 1.2 /100 | #232 | Tragic 18.3% |