Alaska Native vs Inupiat Child Poverty Under the Age of 16
COMPARE
Alaska Native
Inupiat
Child Poverty Under the Age of 16
Child Poverty Under the Age of 16 Comparison
Alaska Natives
Inupiat
17.2%
CHILD POVERTY UNDER THE AGE OF 16
11.8/ 100
METRIC RATING
206th/ 347
METRIC RANK
19.2%
CHILD POVERTY UNDER THE AGE OF 16
0.2/ 100
METRIC RATING
256th/ 347
METRIC RANK
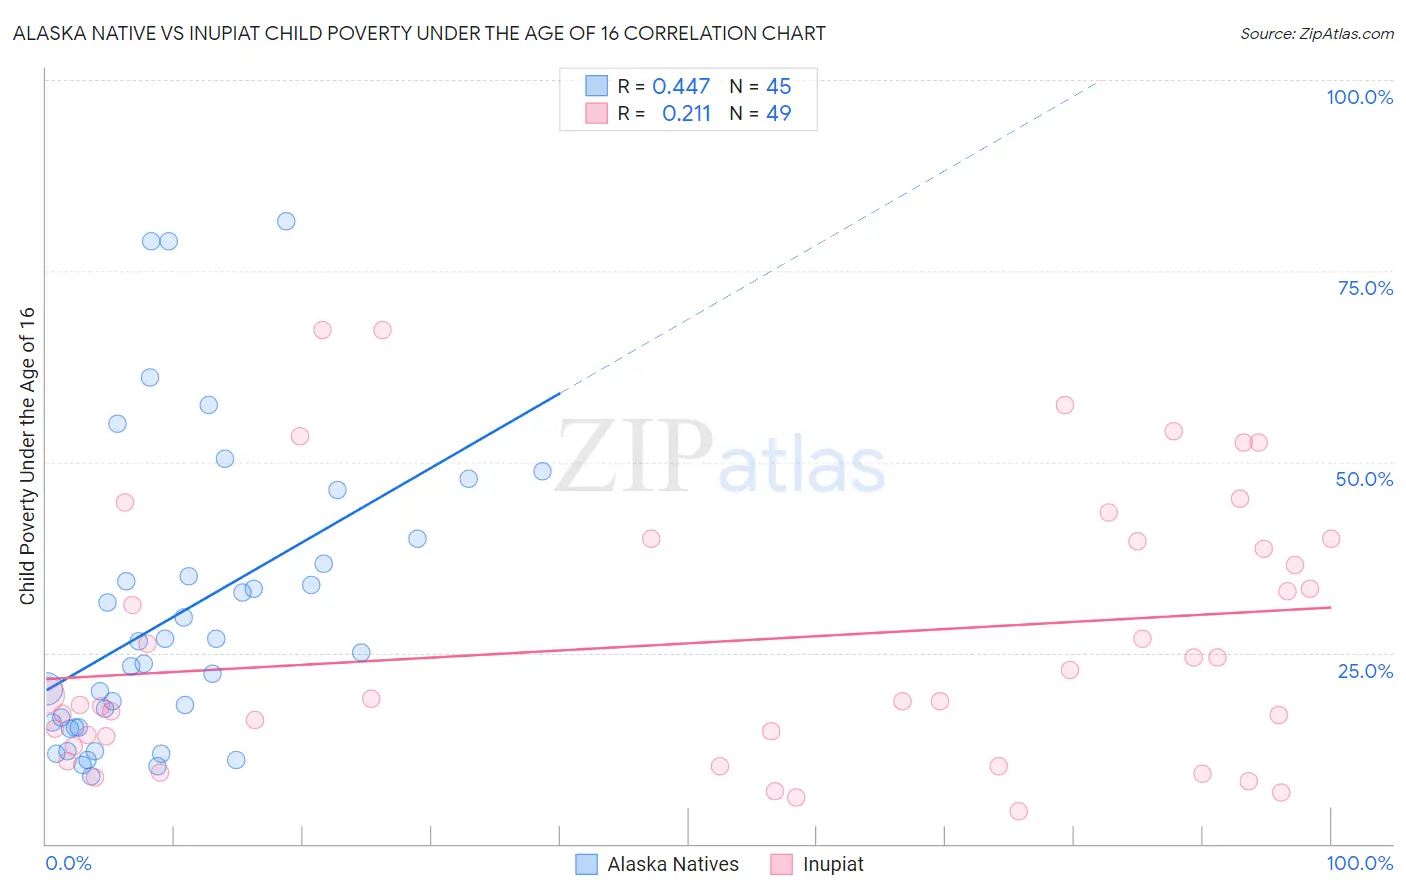
Alaska Native vs Inupiat Child Poverty Under the Age of 16 Correlation Chart
The statistical analysis conducted on geographies consisting of 76,612,165 people shows a moderate positive correlation between the proportion of Alaska Natives and poverty level among children under the age of 16 in the United States with a correlation coefficient (R) of 0.447 and weighted average of 17.2%. Similarly, the statistical analysis conducted on geographies consisting of 96,193,869 people shows a weak positive correlation between the proportion of Inupiat and poverty level among children under the age of 16 in the United States with a correlation coefficient (R) of 0.211 and weighted average of 19.2%, a difference of 11.8%.
Child Poverty Under the Age of 16 Correlation Summary
| Measurement | Alaska Native | Inupiat |
| Minimum | 8.9% | 4.3% |
| Maximum | 81.6% | 67.3% |
| Range | 72.7% | 63.0% |
| Mean | 30.2% | 26.4% |
| Median | 25.0% | 19.0% |
| Interquartile 25% (IQ1) | 15.2% | 13.5% |
| Interquartile 75% (IQ3) | 38.3% | 39.8% |
| Interquartile Range (IQR) | 23.1% | 26.4% |
| Standard Deviation (Sample) | 19.4% | 17.2% |
| Standard Deviation (Population) | 19.1% | 17.0% |
Similar Demographics by Child Poverty Under the Age of 16
Demographics Similar to Alaska Natives by Child Poverty Under the Age of 16
In terms of child poverty under the age of 16, the demographic groups most similar to Alaska Natives are Aleut (17.1%, a difference of 0.54%), Hmong (17.1%, a difference of 0.55%), Immigrants from Sierra Leone (17.1%, a difference of 0.61%), Ugandan (17.1%, a difference of 0.63%), and Immigrants from Uzbekistan (17.1%, a difference of 0.71%).
| Demographics | Rating | Rank | Child Poverty Under the Age of 16 |
| Immigrants | Afghanistan | 15.1 /100 | #199 | Poor 17.0% |
| Immigrants | Cameroon | 14.7 /100 | #200 | Poor 17.1% |
| Immigrants | Uzbekistan | 14.7 /100 | #201 | Poor 17.1% |
| Ugandans | 14.3 /100 | #202 | Poor 17.1% |
| Immigrants | Sierra Leone | 14.2 /100 | #203 | Poor 17.1% |
| Hmong | 14.0 /100 | #204 | Poor 17.1% |
| Aleuts | 13.9 /100 | #205 | Poor 17.1% |
| Alaska Natives | 11.8 /100 | #206 | Poor 17.2% |
| German Russians | 8.6 /100 | #207 | Tragic 17.4% |
| Pennsylvania Germans | 7.5 /100 | #208 | Tragic 17.4% |
| Panamanians | 6.9 /100 | #209 | Tragic 17.5% |
| Alaskan Athabascans | 6.9 /100 | #210 | Tragic 17.5% |
| Immigrants | Thailand | 6.6 /100 | #211 | Tragic 17.5% |
| Immigrants | Immigrants | 6.5 /100 | #212 | Tragic 17.5% |
| Immigrants | Azores | 6.2 /100 | #213 | Tragic 17.5% |
Demographics Similar to Inupiat by Child Poverty Under the Age of 16
In terms of child poverty under the age of 16, the demographic groups most similar to Inupiat are Ottawa (19.2%, a difference of 0.020%), Trinidadian and Tobagonian (19.2%, a difference of 0.090%), Spanish American (19.2%, a difference of 0.090%), Immigrants from Western Africa (19.2%, a difference of 0.26%), and Salvadoran (19.1%, a difference of 0.50%).
| Demographics | Rating | Rank | Child Poverty Under the Age of 16 |
| Potawatomi | 0.3 /100 | #249 | Tragic 19.0% |
| Immigrants | Middle Africa | 0.3 /100 | #250 | Tragic 19.0% |
| Immigrants | Ghana | 0.3 /100 | #251 | Tragic 19.1% |
| Immigrants | Trinidad and Tobago | 0.3 /100 | #252 | Tragic 19.1% |
| Salvadorans | 0.3 /100 | #253 | Tragic 19.1% |
| Immigrants | Western Africa | 0.2 /100 | #254 | Tragic 19.2% |
| Trinidadians and Tobagonians | 0.2 /100 | #255 | Tragic 19.2% |
| Inupiat | 0.2 /100 | #256 | Tragic 19.2% |
| Ottawa | 0.2 /100 | #257 | Tragic 19.2% |
| Spanish Americans | 0.2 /100 | #258 | Tragic 19.2% |
| Mexican American Indians | 0.2 /100 | #259 | Tragic 19.3% |
| Guyanese | 0.2 /100 | #260 | Tragic 19.3% |
| Immigrants | Burma/Myanmar | 0.1 /100 | #261 | Tragic 19.4% |
| Immigrants | Guyana | 0.1 /100 | #262 | Tragic 19.4% |
| Vietnamese | 0.1 /100 | #263 | Tragic 19.4% |