Alaska Native vs Immigrants from El Salvador Child Poverty Under the Age of 16
COMPARE
Alaska Native
Immigrants from El Salvador
Child Poverty Under the Age of 16
Child Poverty Under the Age of 16 Comparison
Alaska Natives
Immigrants from El Salvador
17.2%
CHILD POVERTY UNDER THE AGE OF 16
11.8/ 100
METRIC RATING
206th/ 347
METRIC RANK
19.7%
CHILD POVERTY UNDER THE AGE OF 16
0.1/ 100
METRIC RATING
269th/ 347
METRIC RANK
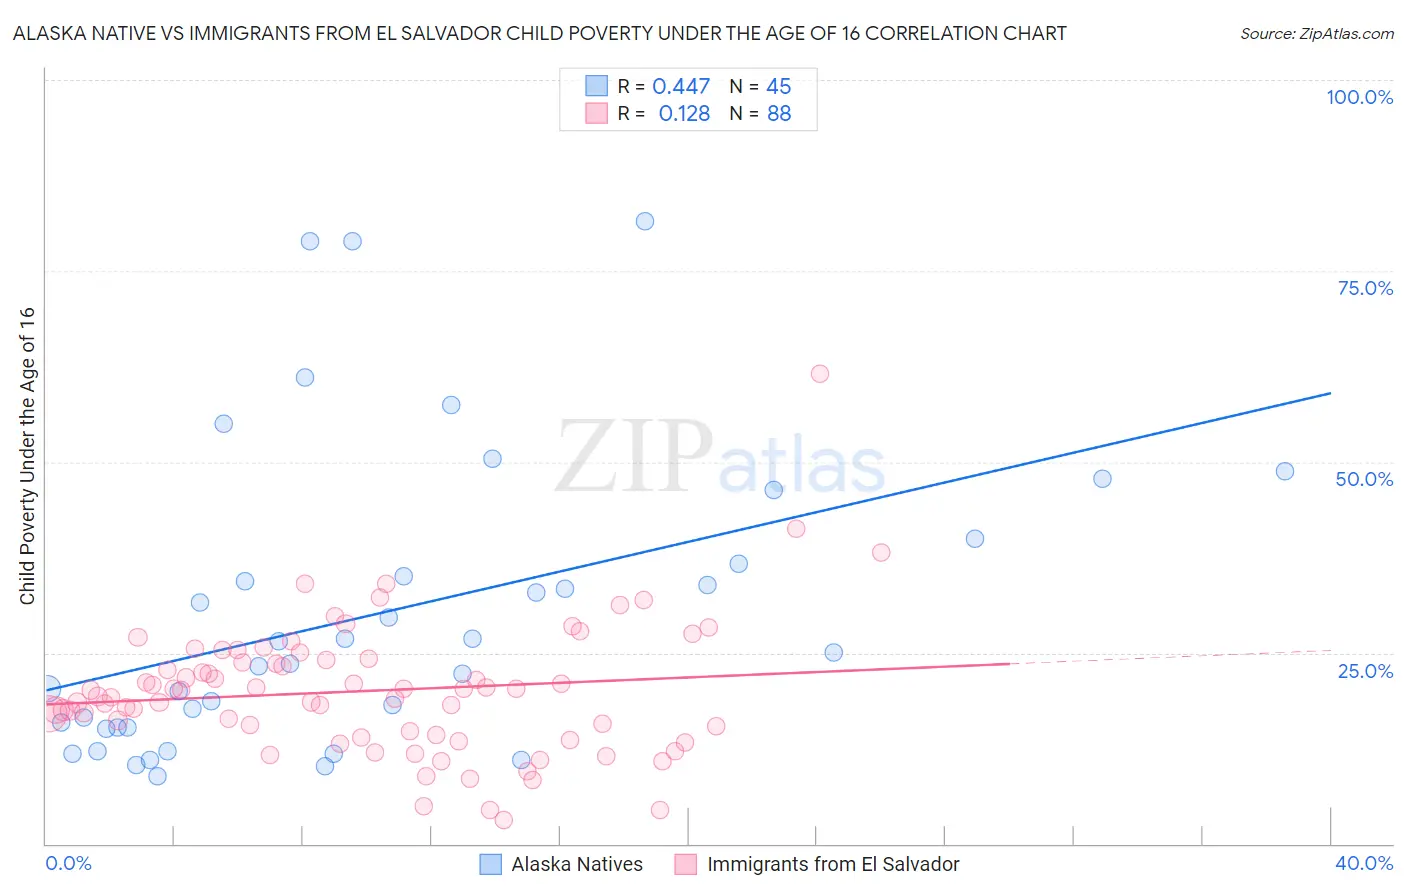
Alaska Native vs Immigrants from El Salvador Child Poverty Under the Age of 16 Correlation Chart
The statistical analysis conducted on geographies consisting of 76,612,165 people shows a moderate positive correlation between the proportion of Alaska Natives and poverty level among children under the age of 16 in the United States with a correlation coefficient (R) of 0.447 and weighted average of 17.2%. Similarly, the statistical analysis conducted on geographies consisting of 356,111,542 people shows a poor positive correlation between the proportion of Immigrants from El Salvador and poverty level among children under the age of 16 in the United States with a correlation coefficient (R) of 0.128 and weighted average of 19.7%, a difference of 14.6%.
Child Poverty Under the Age of 16 Correlation Summary
| Measurement | Alaska Native | Immigrants from El Salvador |
| Minimum | 8.9% | 3.1% |
| Maximum | 81.6% | 61.6% |
| Range | 72.7% | 58.5% |
| Mean | 30.2% | 20.0% |
| Median | 25.0% | 19.7% |
| Interquartile 25% (IQ1) | 15.2% | 14.4% |
| Interquartile 75% (IQ3) | 38.3% | 24.1% |
| Interquartile Range (IQR) | 23.1% | 9.7% |
| Standard Deviation (Sample) | 19.4% | 8.7% |
| Standard Deviation (Population) | 19.1% | 8.7% |
Similar Demographics by Child Poverty Under the Age of 16
Demographics Similar to Alaska Natives by Child Poverty Under the Age of 16
In terms of child poverty under the age of 16, the demographic groups most similar to Alaska Natives are Aleut (17.1%, a difference of 0.54%), Hmong (17.1%, a difference of 0.55%), Immigrants from Sierra Leone (17.1%, a difference of 0.61%), Ugandan (17.1%, a difference of 0.63%), and Immigrants from Uzbekistan (17.1%, a difference of 0.71%).
| Demographics | Rating | Rank | Child Poverty Under the Age of 16 |
| Immigrants | Afghanistan | 15.1 /100 | #199 | Poor 17.0% |
| Immigrants | Cameroon | 14.7 /100 | #200 | Poor 17.1% |
| Immigrants | Uzbekistan | 14.7 /100 | #201 | Poor 17.1% |
| Ugandans | 14.3 /100 | #202 | Poor 17.1% |
| Immigrants | Sierra Leone | 14.2 /100 | #203 | Poor 17.1% |
| Hmong | 14.0 /100 | #204 | Poor 17.1% |
| Aleuts | 13.9 /100 | #205 | Poor 17.1% |
| Alaska Natives | 11.8 /100 | #206 | Poor 17.2% |
| German Russians | 8.6 /100 | #207 | Tragic 17.4% |
| Pennsylvania Germans | 7.5 /100 | #208 | Tragic 17.4% |
| Panamanians | 6.9 /100 | #209 | Tragic 17.5% |
| Alaskan Athabascans | 6.9 /100 | #210 | Tragic 17.5% |
| Immigrants | Thailand | 6.6 /100 | #211 | Tragic 17.5% |
| Immigrants | Immigrants | 6.5 /100 | #212 | Tragic 17.5% |
| Immigrants | Azores | 6.2 /100 | #213 | Tragic 17.5% |
Demographics Similar to Immigrants from El Salvador by Child Poverty Under the Age of 16
In terms of child poverty under the age of 16, the demographic groups most similar to Immigrants from El Salvador are Spanish American Indian (19.7%, a difference of 0.020%), Jamaican (19.7%, a difference of 0.060%), Immigrants from Liberia (19.7%, a difference of 0.15%), Immigrants from Bangladesh (19.8%, a difference of 0.46%), and Immigrants from Jamaica (19.8%, a difference of 0.69%).
| Demographics | Rating | Rank | Child Poverty Under the Age of 16 |
| Immigrants | Guyana | 0.1 /100 | #262 | Tragic 19.4% |
| Vietnamese | 0.1 /100 | #263 | Tragic 19.4% |
| Immigrants | Ecuador | 0.1 /100 | #264 | Tragic 19.4% |
| Chickasaw | 0.1 /100 | #265 | Tragic 19.5% |
| Liberians | 0.1 /100 | #266 | Tragic 19.5% |
| Cherokee | 0.1 /100 | #267 | Tragic 19.5% |
| Jamaicans | 0.1 /100 | #268 | Tragic 19.7% |
| Immigrants | El Salvador | 0.1 /100 | #269 | Tragic 19.7% |
| Spanish American Indians | 0.1 /100 | #270 | Tragic 19.7% |
| Immigrants | Liberia | 0.1 /100 | #271 | Tragic 19.7% |
| Immigrants | Bangladesh | 0.1 /100 | #272 | Tragic 19.8% |
| Immigrants | Jamaica | 0.1 /100 | #273 | Tragic 19.8% |
| Immigrants | Cabo Verde | 0.1 /100 | #274 | Tragic 19.9% |
| Immigrants | Barbados | 0.1 /100 | #275 | Tragic 19.9% |
| Belizeans | 0.1 /100 | #276 | Tragic 19.9% |