Alaska Native vs Haitian Unemployment Among Ages 16 to 19 years
COMPARE
Alaska Native
Haitian
Unemployment Among Ages 16 to 19 years
Unemployment Among Ages 16 to 19 years Comparison
Alaska Natives
Haitians
21.8%
UNEMPLOYMENT AMONG AGES 16 TO 19 YEARS
0.0/ 100
METRIC RATING
314th/ 347
METRIC RANK
20.5%
UNEMPLOYMENT AMONG AGES 16 TO 19 YEARS
0.0/ 100
METRIC RATING
298th/ 347
METRIC RANK
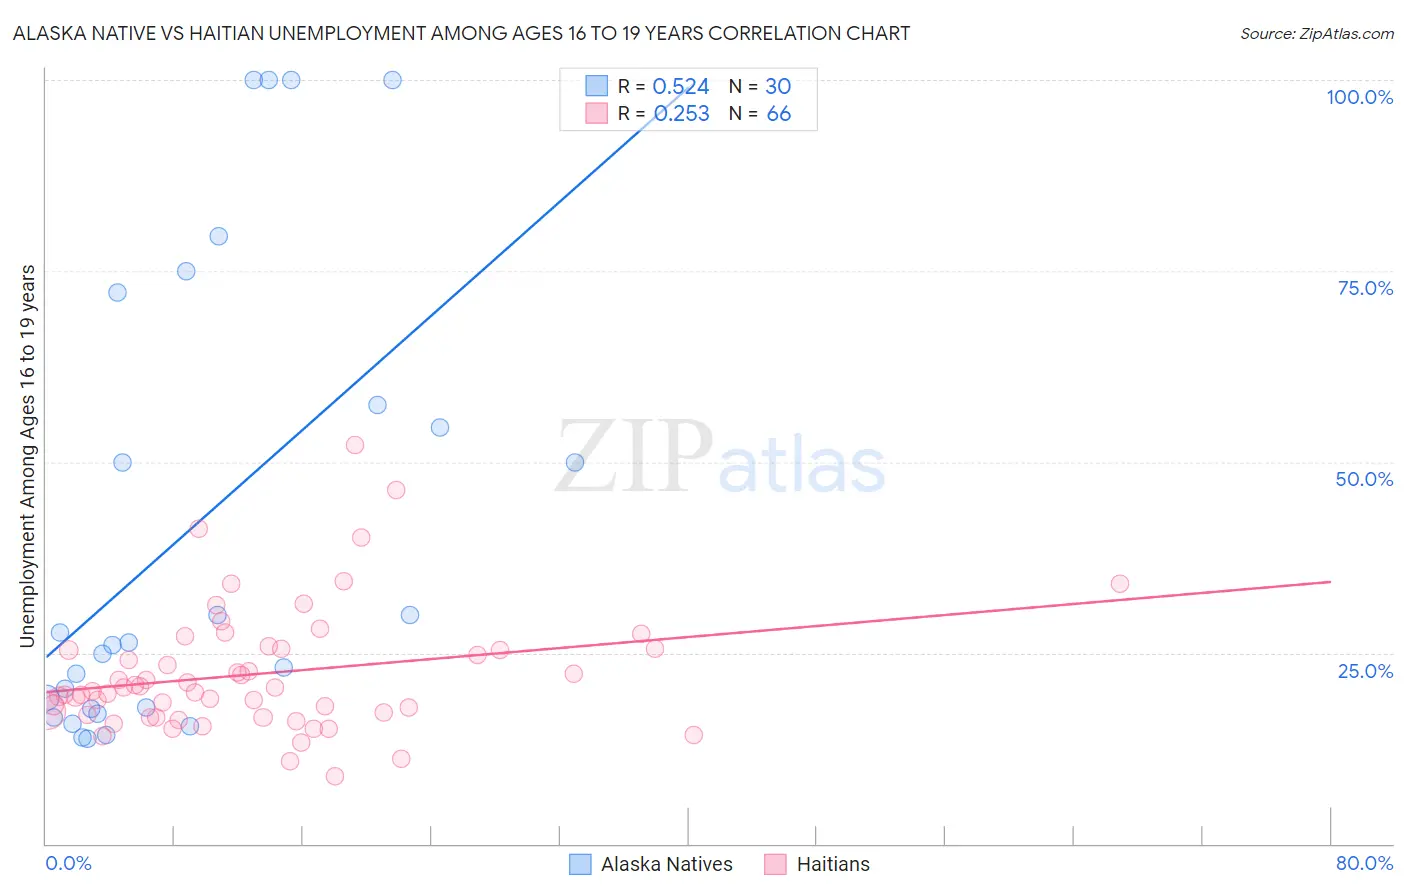
Alaska Native vs Haitian Unemployment Among Ages 16 to 19 years Correlation Chart
The statistical analysis conducted on geographies consisting of 76,044,385 people shows a substantial positive correlation between the proportion of Alaska Natives and unemployment rate among population between the ages 16 and 19 in the United States with a correlation coefficient (R) of 0.524 and weighted average of 21.8%. Similarly, the statistical analysis conducted on geographies consisting of 276,876,873 people shows a weak positive correlation between the proportion of Haitians and unemployment rate among population between the ages 16 and 19 in the United States with a correlation coefficient (R) of 0.253 and weighted average of 20.5%, a difference of 6.0%.
Unemployment Among Ages 16 to 19 years Correlation Summary
| Measurement | Alaska Native | Haitian |
| Minimum | 13.8% | 8.8% |
| Maximum | 100.0% | 52.3% |
| Range | 86.2% | 43.5% |
| Mean | 41.0% | 22.2% |
| Median | 26.2% | 20.2% |
| Interquartile 25% (IQ1) | 17.7% | 16.9% |
| Interquartile 75% (IQ3) | 57.5% | 25.6% |
| Interquartile Range (IQR) | 39.7% | 8.7% |
| Standard Deviation (Sample) | 30.3% | 8.1% |
| Standard Deviation (Population) | 29.8% | 8.1% |
Demographics Similar to Alaska Natives and Haitians by Unemployment Among Ages 16 to 19 years
In terms of unemployment among ages 16 to 19 years, the demographic groups most similar to Alaska Natives are Jamaican (21.7%, a difference of 0.16%), Houma (21.6%, a difference of 0.58%), Belizean (21.6%, a difference of 0.84%), Immigrants from Dominica (21.9%, a difference of 0.85%), and Vietnamese (21.5%, a difference of 1.1%). Similarly, the demographic groups most similar to Haitians are Immigrants from Uzbekistan (20.5%, a difference of 0.050%), Alsatian (20.5%, a difference of 0.060%), Armenian (20.5%, a difference of 0.080%), Ecuadorian (20.5%, a difference of 0.14%), and Immigrants from Ecuador (20.9%, a difference of 1.7%).
| Demographics | Rating | Rank | Unemployment Among Ages 16 to 19 years |
| Armenians | 0.0 /100 | #296 | Tragic 20.5% |
| Alsatians | 0.0 /100 | #297 | Tragic 20.5% |
| Haitians | 0.0 /100 | #298 | Tragic 20.5% |
| Immigrants | Uzbekistan | 0.0 /100 | #299 | Tragic 20.5% |
| Ecuadorians | 0.0 /100 | #300 | Tragic 20.5% |
| Immigrants | Ecuador | 0.0 /100 | #301 | Tragic 20.9% |
| Immigrants | Caribbean | 0.0 /100 | #302 | Tragic 20.9% |
| Senegalese | 0.0 /100 | #303 | Tragic 21.0% |
| Aleuts | 0.0 /100 | #304 | Tragic 21.2% |
| Immigrants | Senegal | 0.0 /100 | #305 | Tragic 21.2% |
| U.S. Virgin Islanders | 0.0 /100 | #306 | Tragic 21.3% |
| Blacks/African Americans | 0.0 /100 | #307 | Tragic 21.4% |
| Immigrants | Bangladesh | 0.0 /100 | #308 | Tragic 21.5% |
| Natives/Alaskans | 0.0 /100 | #309 | Tragic 21.5% |
| Vietnamese | 0.0 /100 | #310 | Tragic 21.5% |
| Belizeans | 0.0 /100 | #311 | Tragic 21.6% |
| Houma | 0.0 /100 | #312 | Tragic 21.6% |
| Jamaicans | 0.0 /100 | #313 | Tragic 21.7% |
| Alaska Natives | 0.0 /100 | #314 | Tragic 21.8% |
| Immigrants | Dominica | 0.0 /100 | #315 | Tragic 21.9% |
| Tohono O'odham | 0.0 /100 | #316 | Tragic 22.1% |