African vs Tohono O'odham Female Poverty Among 18-24 Year Olds
COMPARE
African
Tohono O'odham
Female Poverty Among 18-24 Year Olds
Female Poverty Among 18-24 Year Olds Comparison
Africans
Tohono O'odham
22.8%
FEMALE POVERTY AMONG 18-24 YEAR OLDS
0.0/ 100
METRIC RATING
300th/ 347
METRIC RANK
31.0%
FEMALE POVERTY AMONG 18-24 YEAR OLDS
0.0/ 100
METRIC RATING
345th/ 347
METRIC RANK
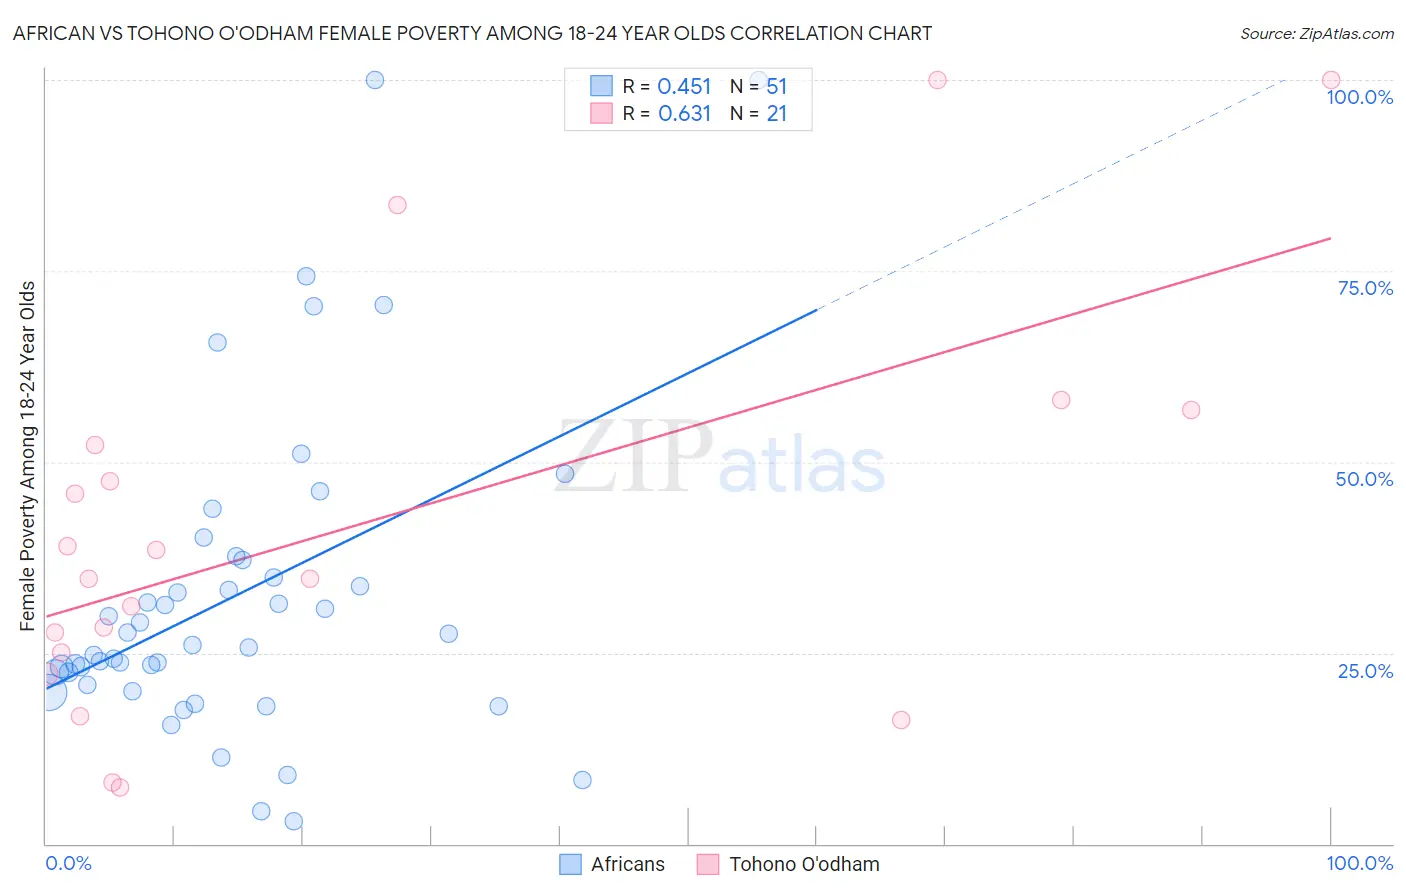
African vs Tohono O'odham Female Poverty Among 18-24 Year Olds Correlation Chart
The statistical analysis conducted on geographies consisting of 458,558,790 people shows a moderate positive correlation between the proportion of Africans and poverty level among females between the ages 18 and 24 in the United States with a correlation coefficient (R) of 0.451 and weighted average of 22.8%. Similarly, the statistical analysis conducted on geographies consisting of 58,612,665 people shows a significant positive correlation between the proportion of Tohono O'odham and poverty level among females between the ages 18 and 24 in the United States with a correlation coefficient (R) of 0.631 and weighted average of 31.0%, a difference of 35.7%.
Female Poverty Among 18-24 Year Olds Correlation Summary
| Measurement | African | Tohono O'odham |
| Minimum | 2.9% | 7.4% |
| Maximum | 100.0% | 100.0% |
| Range | 97.1% | 92.6% |
| Mean | 32.4% | 41.6% |
| Median | 26.0% | 34.7% |
| Interquartile 25% (IQ1) | 20.8% | 23.7% |
| Interquartile 75% (IQ3) | 37.2% | 54.5% |
| Interquartile Range (IQR) | 16.4% | 30.8% |
| Standard Deviation (Sample) | 20.9% | 26.5% |
| Standard Deviation (Population) | 20.7% | 25.9% |
Similar Demographics by Female Poverty Among 18-24 Year Olds
Demographics Similar to Africans by Female Poverty Among 18-24 Year Olds
In terms of female poverty among 18-24 year olds, the demographic groups most similar to Africans are Seminole (22.9%, a difference of 0.090%), Iroquois (22.9%, a difference of 0.48%), Senegalese (23.0%, a difference of 0.63%), Cherokee (22.7%, a difference of 0.72%), and Sudanese (23.0%, a difference of 0.77%).
| Demographics | Rating | Rank | Female Poverty Among 18-24 Year Olds |
| U.S. Virgin Islanders | 0.0 /100 | #293 | Tragic 22.5% |
| Indonesians | 0.0 /100 | #294 | Tragic 22.5% |
| Shoshone | 0.0 /100 | #295 | Tragic 22.5% |
| Menominee | 0.0 /100 | #296 | Tragic 22.5% |
| Inupiat | 0.0 /100 | #297 | Tragic 22.6% |
| Central American Indians | 0.0 /100 | #298 | Tragic 22.6% |
| Cherokee | 0.0 /100 | #299 | Tragic 22.7% |
| Africans | 0.0 /100 | #300 | Tragic 22.8% |
| Seminole | 0.0 /100 | #301 | Tragic 22.9% |
| Iroquois | 0.0 /100 | #302 | Tragic 22.9% |
| Senegalese | 0.0 /100 | #303 | Tragic 23.0% |
| Sudanese | 0.0 /100 | #304 | Tragic 23.0% |
| Immigrants | Kuwait | 0.0 /100 | #305 | Tragic 23.0% |
| Paiute | 0.0 /100 | #306 | Tragic 23.3% |
| Cree | 0.0 /100 | #307 | Tragic 23.4% |
Demographics Similar to Tohono O'odham by Female Poverty Among 18-24 Year Olds
In terms of female poverty among 18-24 year olds, the demographic groups most similar to Tohono O'odham are Lumbee (31.1%, a difference of 0.16%), Navajo (30.3%, a difference of 2.3%), Puerto Rican (29.8%, a difference of 3.9%), Kiowa (29.2%, a difference of 6.1%), and Colville (29.0%, a difference of 6.9%).
| Demographics | Rating | Rank | Female Poverty Among 18-24 Year Olds |
| Apache | 0.0 /100 | #333 | Tragic 26.3% |
| Pueblo | 0.0 /100 | #334 | Tragic 26.9% |
| Yup'ik | 0.0 /100 | #335 | Tragic 27.0% |
| Immigrants | Yemen | 0.0 /100 | #336 | Tragic 27.5% |
| Cheyenne | 0.0 /100 | #337 | Tragic 28.1% |
| Hopi | 0.0 /100 | #338 | Tragic 28.2% |
| Pima | 0.0 /100 | #339 | Tragic 28.4% |
| Sioux | 0.0 /100 | #340 | Tragic 28.6% |
| Colville | 0.0 /100 | #341 | Tragic 29.0% |
| Kiowa | 0.0 /100 | #342 | Tragic 29.2% |
| Puerto Ricans | 0.0 /100 | #343 | Tragic 29.8% |
| Navajo | 0.0 /100 | #344 | Tragic 30.3% |
| Tohono O'odham | 0.0 /100 | #345 | Tragic 31.0% |
| Lumbee | 0.0 /100 | #346 | Tragic 31.1% |
| Crow | 0.0 /100 | #347 | Tragic 33.2% |