African vs Immigrants from Chile Female Poverty Among 18-24 Year Olds
COMPARE
African
Immigrants from Chile
Female Poverty Among 18-24 Year Olds
Female Poverty Among 18-24 Year Olds Comparison
Africans
Immigrants from Chile
22.8%
FEMALE POVERTY AMONG 18-24 YEAR OLDS
0.0/ 100
METRIC RATING
300th/ 347
METRIC RANK
19.4%
FEMALE POVERTY AMONG 18-24 YEAR OLDS
94.3/ 100
METRIC RATING
124th/ 347
METRIC RANK
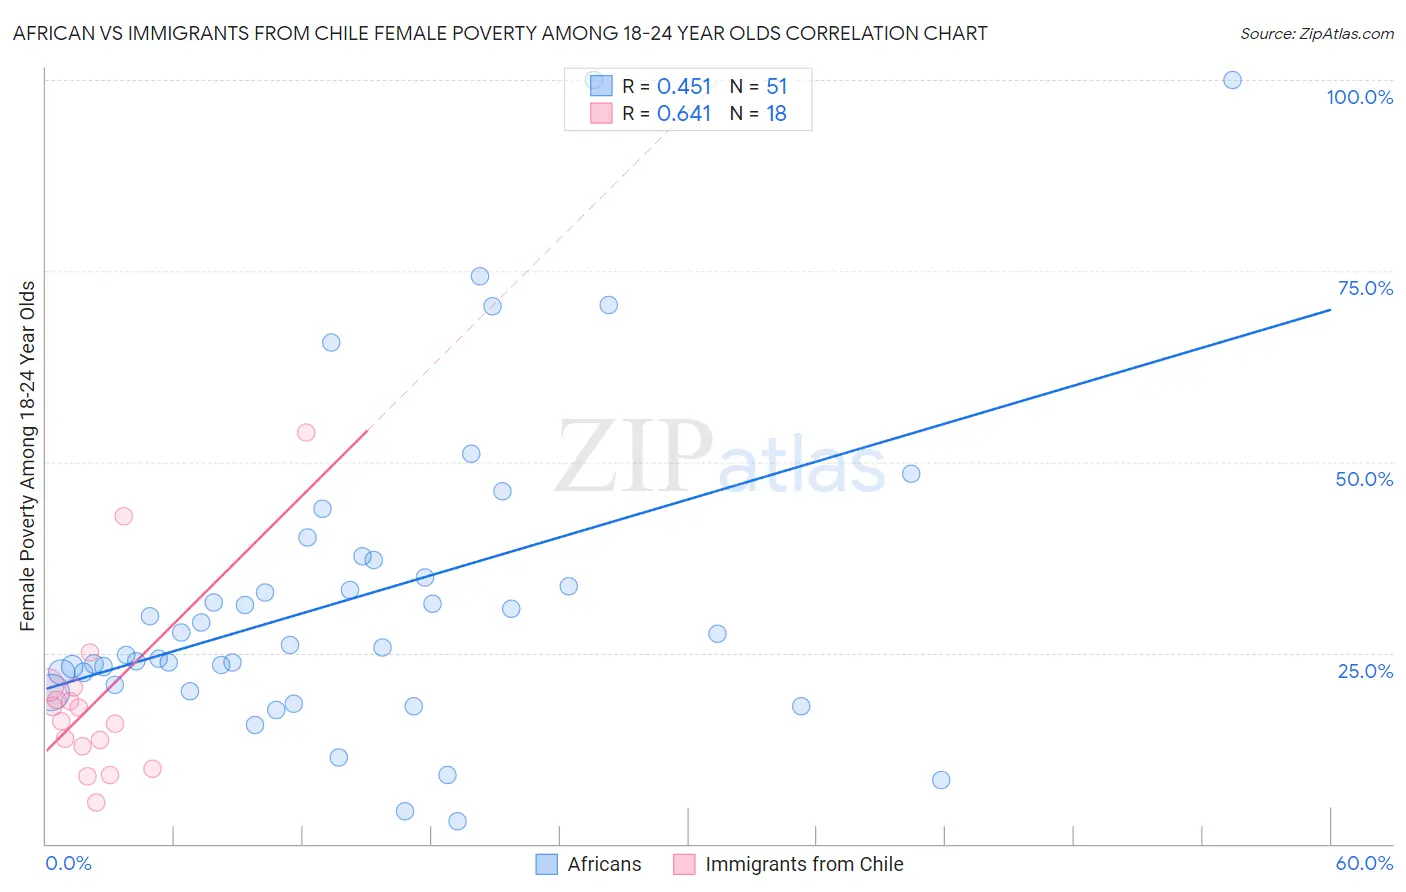
African vs Immigrants from Chile Female Poverty Among 18-24 Year Olds Correlation Chart
The statistical analysis conducted on geographies consisting of 458,558,790 people shows a moderate positive correlation between the proportion of Africans and poverty level among females between the ages 18 and 24 in the United States with a correlation coefficient (R) of 0.451 and weighted average of 22.8%. Similarly, the statistical analysis conducted on geographies consisting of 216,013,605 people shows a significant positive correlation between the proportion of Immigrants from Chile and poverty level among females between the ages 18 and 24 in the United States with a correlation coefficient (R) of 0.641 and weighted average of 19.4%, a difference of 17.7%.
Female Poverty Among 18-24 Year Olds Correlation Summary
| Measurement | African | Immigrants from Chile |
| Minimum | 2.9% | 5.3% |
| Maximum | 100.0% | 53.8% |
| Range | 97.1% | 48.5% |
| Mean | 32.4% | 18.9% |
| Median | 26.0% | 16.9% |
| Interquartile 25% (IQ1) | 20.8% | 12.8% |
| Interquartile 75% (IQ3) | 37.2% | 20.4% |
| Interquartile Range (IQR) | 16.4% | 7.7% |
| Standard Deviation (Sample) | 20.9% | 11.9% |
| Standard Deviation (Population) | 20.7% | 11.6% |
Similar Demographics by Female Poverty Among 18-24 Year Olds
Demographics Similar to Africans by Female Poverty Among 18-24 Year Olds
In terms of female poverty among 18-24 year olds, the demographic groups most similar to Africans are Seminole (22.9%, a difference of 0.090%), Iroquois (22.9%, a difference of 0.48%), Senegalese (23.0%, a difference of 0.63%), Cherokee (22.7%, a difference of 0.72%), and Sudanese (23.0%, a difference of 0.77%).
| Demographics | Rating | Rank | Female Poverty Among 18-24 Year Olds |
| U.S. Virgin Islanders | 0.0 /100 | #293 | Tragic 22.5% |
| Indonesians | 0.0 /100 | #294 | Tragic 22.5% |
| Shoshone | 0.0 /100 | #295 | Tragic 22.5% |
| Menominee | 0.0 /100 | #296 | Tragic 22.5% |
| Inupiat | 0.0 /100 | #297 | Tragic 22.6% |
| Central American Indians | 0.0 /100 | #298 | Tragic 22.6% |
| Cherokee | 0.0 /100 | #299 | Tragic 22.7% |
| Africans | 0.0 /100 | #300 | Tragic 22.8% |
| Seminole | 0.0 /100 | #301 | Tragic 22.9% |
| Iroquois | 0.0 /100 | #302 | Tragic 22.9% |
| Senegalese | 0.0 /100 | #303 | Tragic 23.0% |
| Sudanese | 0.0 /100 | #304 | Tragic 23.0% |
| Immigrants | Kuwait | 0.0 /100 | #305 | Tragic 23.0% |
| Paiute | 0.0 /100 | #306 | Tragic 23.3% |
| Cree | 0.0 /100 | #307 | Tragic 23.4% |
Demographics Similar to Immigrants from Chile by Female Poverty Among 18-24 Year Olds
In terms of female poverty among 18-24 year olds, the demographic groups most similar to Immigrants from Chile are Immigrants from Panama (19.4%, a difference of 0.060%), Cambodian (19.4%, a difference of 0.070%), Paraguayan (19.4%, a difference of 0.070%), Immigrants from Russia (19.4%, a difference of 0.13%), and Cape Verdean (19.4%, a difference of 0.15%).
| Demographics | Rating | Rank | Female Poverty Among 18-24 Year Olds |
| Immigrants | Iran | 95.8 /100 | #117 | Exceptional 19.3% |
| Immigrants | Guyana | 95.6 /100 | #118 | Exceptional 19.3% |
| Cypriots | 95.5 /100 | #119 | Exceptional 19.3% |
| Immigrants | Northern Europe | 95.4 /100 | #120 | Exceptional 19.4% |
| Guyanese | 95.3 /100 | #121 | Exceptional 19.4% |
| Cambodians | 94.6 /100 | #122 | Exceptional 19.4% |
| Paraguayans | 94.6 /100 | #123 | Exceptional 19.4% |
| Immigrants | Chile | 94.3 /100 | #124 | Exceptional 19.4% |
| Immigrants | Panama | 94.0 /100 | #125 | Exceptional 19.4% |
| Immigrants | Russia | 93.7 /100 | #126 | Exceptional 19.4% |
| Cape Verdeans | 93.6 /100 | #127 | Exceptional 19.4% |
| Slovaks | 92.9 /100 | #128 | Exceptional 19.5% |
| Immigrants | England | 92.9 /100 | #129 | Exceptional 19.5% |
| Immigrants | Canada | 92.9 /100 | #130 | Exceptional 19.5% |
| Latvians | 92.7 /100 | #131 | Exceptional 19.5% |