Immigrants from Dominican Republic vs Serbian Female Poverty Among 18-24 Year Olds
COMPARE
Immigrants from Dominican Republic
Serbian
Female Poverty Among 18-24 Year Olds
Female Poverty Among 18-24 Year Olds Comparison
Immigrants from Dominican Republic
Serbians
21.9%
FEMALE POVERTY AMONG 18-24 YEAR OLDS
0.1/ 100
METRIC RATING
281st/ 347
METRIC RANK
19.1%
FEMALE POVERTY AMONG 18-24 YEAR OLDS
98.0/ 100
METRIC RATING
103rd/ 347
METRIC RANK
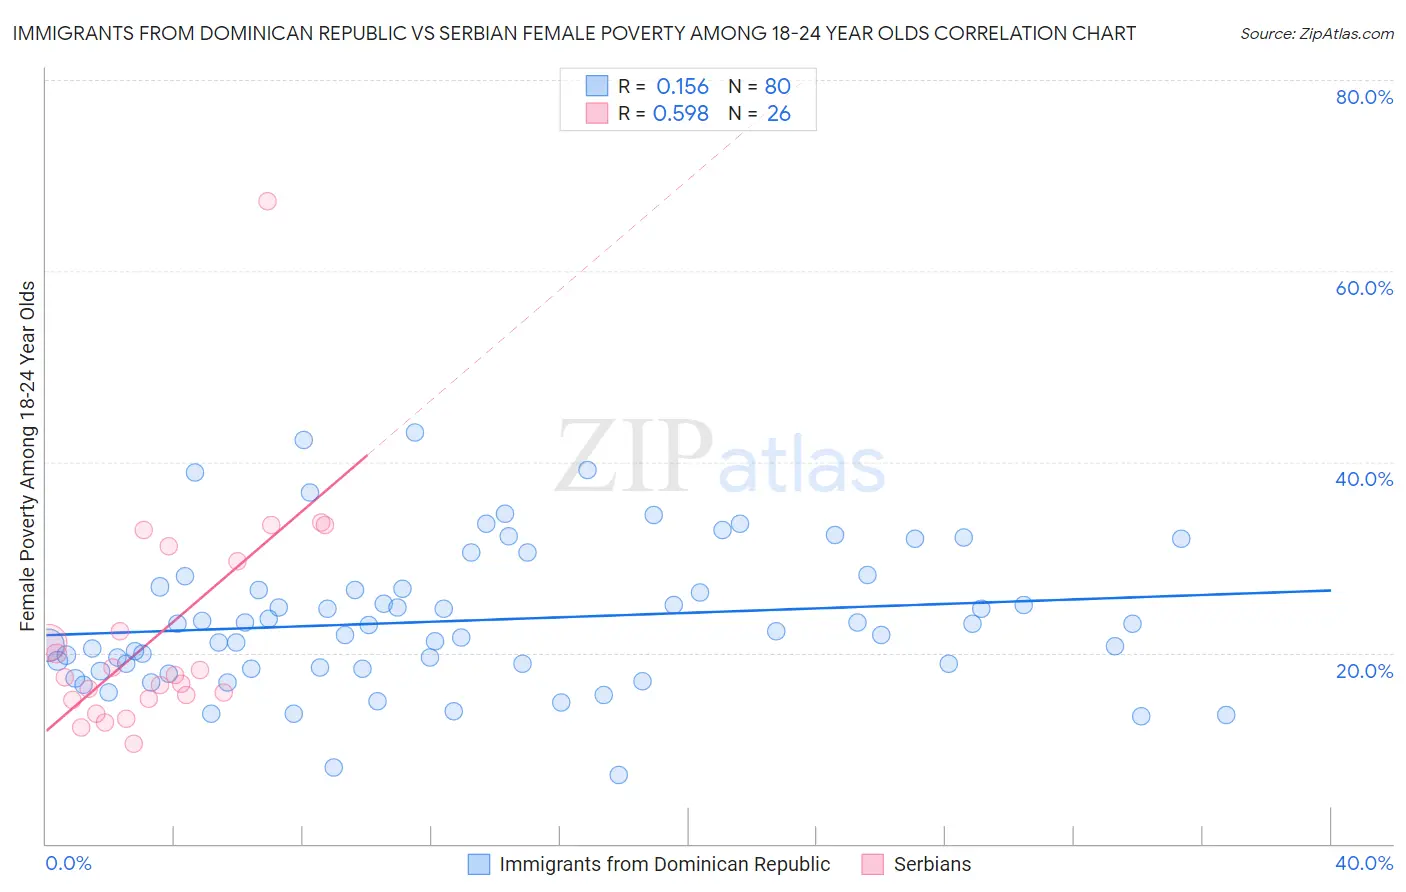
Immigrants from Dominican Republic vs Serbian Female Poverty Among 18-24 Year Olds Correlation Chart
The statistical analysis conducted on geographies consisting of 269,456,906 people shows a poor positive correlation between the proportion of Immigrants from Dominican Republic and poverty level among females between the ages 18 and 24 in the United States with a correlation coefficient (R) of 0.156 and weighted average of 21.9%. Similarly, the statistical analysis conducted on geographies consisting of 262,500,209 people shows a substantial positive correlation between the proportion of Serbians and poverty level among females between the ages 18 and 24 in the United States with a correlation coefficient (R) of 0.598 and weighted average of 19.1%, a difference of 14.6%.
Female Poverty Among 18-24 Year Olds Correlation Summary
| Measurement | Immigrants from Dominican Republic | Serbian |
| Minimum | 7.2% | 10.5% |
| Maximum | 43.1% | 67.3% |
| Range | 35.8% | 56.8% |
| Mean | 23.4% | 21.9% |
| Median | 22.5% | 17.5% |
| Interquartile 25% (IQ1) | 18.4% | 15.2% |
| Interquartile 75% (IQ3) | 26.8% | 29.6% |
| Interquartile Range (IQR) | 8.4% | 14.4% |
| Standard Deviation (Sample) | 7.4% | 11.8% |
| Standard Deviation (Population) | 7.4% | 11.6% |
Similar Demographics by Female Poverty Among 18-24 Year Olds
Demographics Similar to Immigrants from Dominican Republic by Female Poverty Among 18-24 Year Olds
In terms of female poverty among 18-24 year olds, the demographic groups most similar to Immigrants from Dominican Republic are Immigrants from Dominica (21.9%, a difference of 0.040%), Spanish American (21.9%, a difference of 0.050%), Bermudan (21.9%, a difference of 0.090%), Yaqui (21.9%, a difference of 0.22%), and Subsaharan African (22.0%, a difference of 0.39%).
| Demographics | Rating | Rank | Female Poverty Among 18-24 Year Olds |
| Immigrants | Honduras | 0.1 /100 | #274 | Tragic 21.8% |
| Immigrants | Bangladesh | 0.1 /100 | #275 | Tragic 21.8% |
| Bahamians | 0.1 /100 | #276 | Tragic 21.8% |
| Immigrants | Switzerland | 0.1 /100 | #277 | Tragic 21.8% |
| Yaqui | 0.1 /100 | #278 | Tragic 21.9% |
| Spanish Americans | 0.1 /100 | #279 | Tragic 21.9% |
| Immigrants | Dominica | 0.1 /100 | #280 | Tragic 21.9% |
| Immigrants | Dominican Republic | 0.1 /100 | #281 | Tragic 21.9% |
| Bermudans | 0.1 /100 | #282 | Tragic 21.9% |
| Sub-Saharan Africans | 0.0 /100 | #283 | Tragic 22.0% |
| Tlingit-Haida | 0.0 /100 | #284 | Tragic 22.0% |
| Ottawa | 0.0 /100 | #285 | Tragic 22.0% |
| Ugandans | 0.0 /100 | #286 | Tragic 22.1% |
| Immigrants | Middle Africa | 0.0 /100 | #287 | Tragic 22.1% |
| Dominicans | 0.0 /100 | #288 | Tragic 22.3% |
Demographics Similar to Serbians by Female Poverty Among 18-24 Year Olds
In terms of female poverty among 18-24 year olds, the demographic groups most similar to Serbians are Immigrants from Caribbean (19.1%, a difference of 0.040%), Immigrants from Afghanistan (19.1%, a difference of 0.040%), Ecuadorian (19.1%, a difference of 0.070%), Immigrants from Ecuador (19.2%, a difference of 0.13%), and Chilean (19.1%, a difference of 0.15%).
| Demographics | Rating | Rank | Female Poverty Among 18-24 Year Olds |
| Sierra Leoneans | 98.7 /100 | #96 | Exceptional 19.0% |
| Salvadorans | 98.4 /100 | #97 | Exceptional 19.1% |
| Immigrants | Jordan | 98.4 /100 | #98 | Exceptional 19.1% |
| Immigrants | Czechoslovakia | 98.3 /100 | #99 | Exceptional 19.1% |
| Chileans | 98.3 /100 | #100 | Exceptional 19.1% |
| Ecuadorians | 98.1 /100 | #101 | Exceptional 19.1% |
| Immigrants | Caribbean | 98.1 /100 | #102 | Exceptional 19.1% |
| Serbians | 98.0 /100 | #103 | Exceptional 19.1% |
| Immigrants | Afghanistan | 98.0 /100 | #104 | Exceptional 19.1% |
| Immigrants | Ecuador | 97.8 /100 | #105 | Exceptional 19.2% |
| Immigrants | Sierra Leone | 97.8 /100 | #106 | Exceptional 19.2% |
| Immigrants | Sri Lanka | 97.5 /100 | #107 | Exceptional 19.2% |
| Immigrants | Uzbekistan | 97.3 /100 | #108 | Exceptional 19.2% |
| Immigrants | Syria | 97.2 /100 | #109 | Exceptional 19.2% |
| Laotians | 97.1 /100 | #110 | Exceptional 19.2% |