Mongolian vs Serbian Female Poverty Among 18-24 Year Olds
COMPARE
Mongolian
Serbian
Female Poverty Among 18-24 Year Olds
Female Poverty Among 18-24 Year Olds Comparison
Mongolians
Serbians
21.6%
FEMALE POVERTY AMONG 18-24 YEAR OLDS
0.2/ 100
METRIC RATING
270th/ 347
METRIC RANK
19.1%
FEMALE POVERTY AMONG 18-24 YEAR OLDS
98.0/ 100
METRIC RATING
103rd/ 347
METRIC RANK
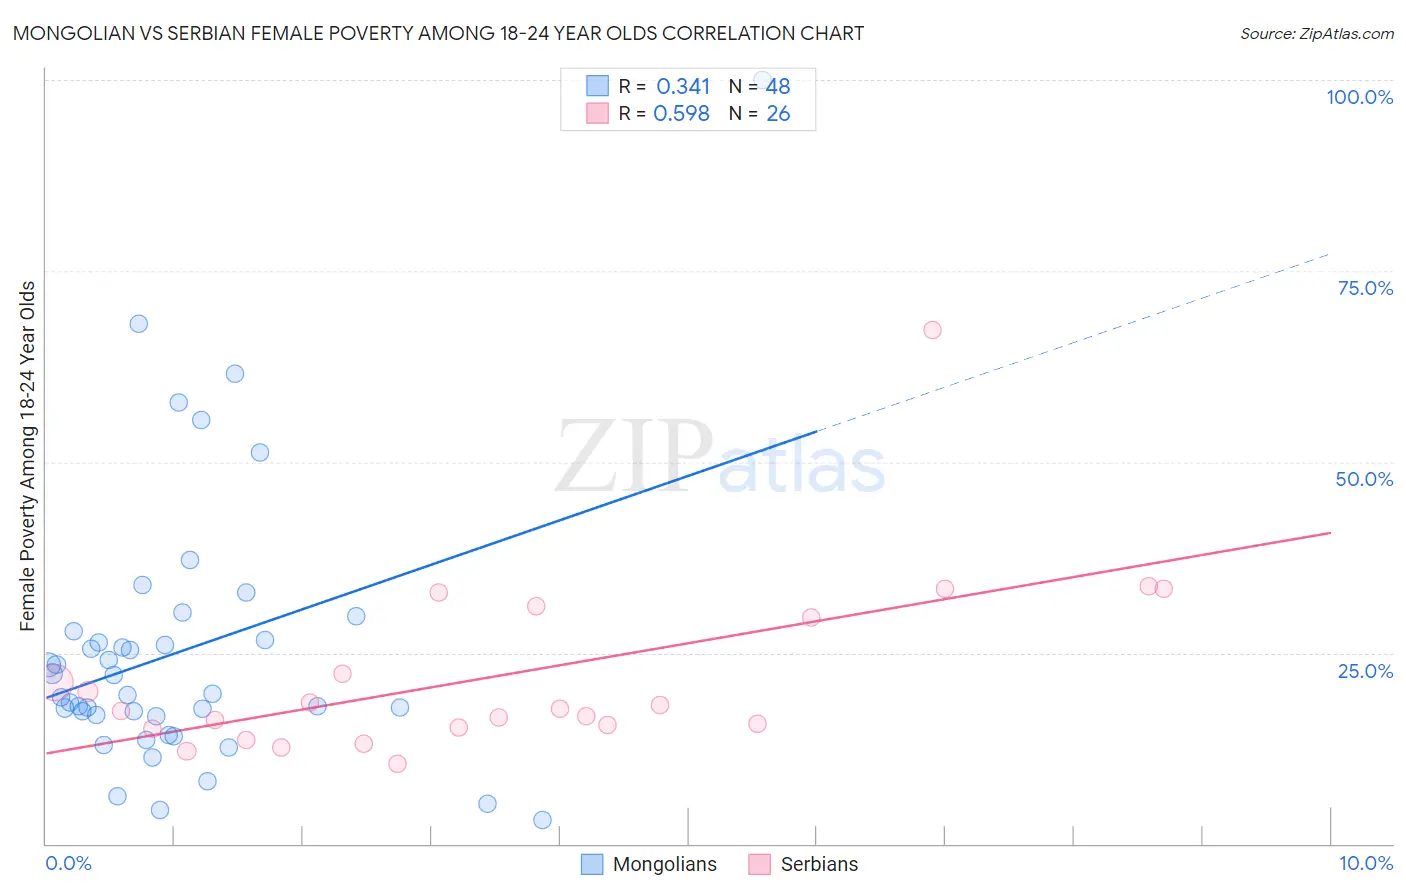
Mongolian vs Serbian Female Poverty Among 18-24 Year Olds Correlation Chart
The statistical analysis conducted on geographies consisting of 139,425,379 people shows a mild positive correlation between the proportion of Mongolians and poverty level among females between the ages 18 and 24 in the United States with a correlation coefficient (R) of 0.341 and weighted average of 21.6%. Similarly, the statistical analysis conducted on geographies consisting of 262,500,209 people shows a substantial positive correlation between the proportion of Serbians and poverty level among females between the ages 18 and 24 in the United States with a correlation coefficient (R) of 0.598 and weighted average of 19.1%, a difference of 12.9%.
Female Poverty Among 18-24 Year Olds Correlation Summary
| Measurement | Mongolian | Serbian |
| Minimum | 3.0% | 10.5% |
| Maximum | 100.0% | 67.3% |
| Range | 97.0% | 56.8% |
| Mean | 25.3% | 21.9% |
| Median | 19.6% | 17.5% |
| Interquartile 25% (IQ1) | 16.8% | 15.2% |
| Interquartile 75% (IQ3) | 27.2% | 29.6% |
| Interquartile Range (IQR) | 10.5% | 14.4% |
| Standard Deviation (Sample) | 18.1% | 11.8% |
| Standard Deviation (Population) | 17.9% | 11.6% |
Similar Demographics by Female Poverty Among 18-24 Year Olds
Demographics Similar to Mongolians by Female Poverty Among 18-24 Year Olds
In terms of female poverty among 18-24 year olds, the demographic groups most similar to Mongolians are Scotch-Irish (21.6%, a difference of 0.010%), Celtic (21.6%, a difference of 0.030%), Immigrants from Burma/Myanmar (21.6%, a difference of 0.090%), American (21.6%, a difference of 0.23%), and Basque (21.7%, a difference of 0.29%).
| Demographics | Rating | Rank | Female Poverty Among 18-24 Year Olds |
| Icelanders | 0.3 /100 | #263 | Tragic 21.5% |
| Hondurans | 0.3 /100 | #264 | Tragic 21.5% |
| Immigrants | Nonimmigrants | 0.3 /100 | #265 | Tragic 21.5% |
| Alaska Natives | 0.3 /100 | #266 | Tragic 21.5% |
| Americans | 0.3 /100 | #267 | Tragic 21.6% |
| Immigrants | Burma/Myanmar | 0.2 /100 | #268 | Tragic 21.6% |
| Celtics | 0.2 /100 | #269 | Tragic 21.6% |
| Mongolians | 0.2 /100 | #270 | Tragic 21.6% |
| Scotch-Irish | 0.2 /100 | #271 | Tragic 21.6% |
| Basques | 0.2 /100 | #272 | Tragic 21.7% |
| New Zealanders | 0.2 /100 | #273 | Tragic 21.7% |
| Immigrants | Honduras | 0.1 /100 | #274 | Tragic 21.8% |
| Immigrants | Bangladesh | 0.1 /100 | #275 | Tragic 21.8% |
| Bahamians | 0.1 /100 | #276 | Tragic 21.8% |
| Immigrants | Switzerland | 0.1 /100 | #277 | Tragic 21.8% |
Demographics Similar to Serbians by Female Poverty Among 18-24 Year Olds
In terms of female poverty among 18-24 year olds, the demographic groups most similar to Serbians are Immigrants from Caribbean (19.1%, a difference of 0.040%), Immigrants from Afghanistan (19.1%, a difference of 0.040%), Ecuadorian (19.1%, a difference of 0.070%), Immigrants from Ecuador (19.2%, a difference of 0.13%), and Chilean (19.1%, a difference of 0.15%).
| Demographics | Rating | Rank | Female Poverty Among 18-24 Year Olds |
| Sierra Leoneans | 98.7 /100 | #96 | Exceptional 19.0% |
| Salvadorans | 98.4 /100 | #97 | Exceptional 19.1% |
| Immigrants | Jordan | 98.4 /100 | #98 | Exceptional 19.1% |
| Immigrants | Czechoslovakia | 98.3 /100 | #99 | Exceptional 19.1% |
| Chileans | 98.3 /100 | #100 | Exceptional 19.1% |
| Ecuadorians | 98.1 /100 | #101 | Exceptional 19.1% |
| Immigrants | Caribbean | 98.1 /100 | #102 | Exceptional 19.1% |
| Serbians | 98.0 /100 | #103 | Exceptional 19.1% |
| Immigrants | Afghanistan | 98.0 /100 | #104 | Exceptional 19.1% |
| Immigrants | Ecuador | 97.8 /100 | #105 | Exceptional 19.2% |
| Immigrants | Sierra Leone | 97.8 /100 | #106 | Exceptional 19.2% |
| Immigrants | Sri Lanka | 97.5 /100 | #107 | Exceptional 19.2% |
| Immigrants | Uzbekistan | 97.3 /100 | #108 | Exceptional 19.2% |
| Immigrants | Syria | 97.2 /100 | #109 | Exceptional 19.2% |
| Laotians | 97.1 /100 | #110 | Exceptional 19.2% |