African vs Immigrants from Russia 12th Grade, No Diploma
COMPARE
African
Immigrants from Russia
12th Grade, No Diploma
12th Grade, No Diploma Comparison
Africans
Immigrants from Russia
89.6%
12TH GRADE, NO DIPLOMA
0.4/ 100
METRIC RATING
258th/ 347
METRIC RANK
92.2%
12TH GRADE, NO DIPLOMA
97.3/ 100
METRIC RATING
106th/ 347
METRIC RANK
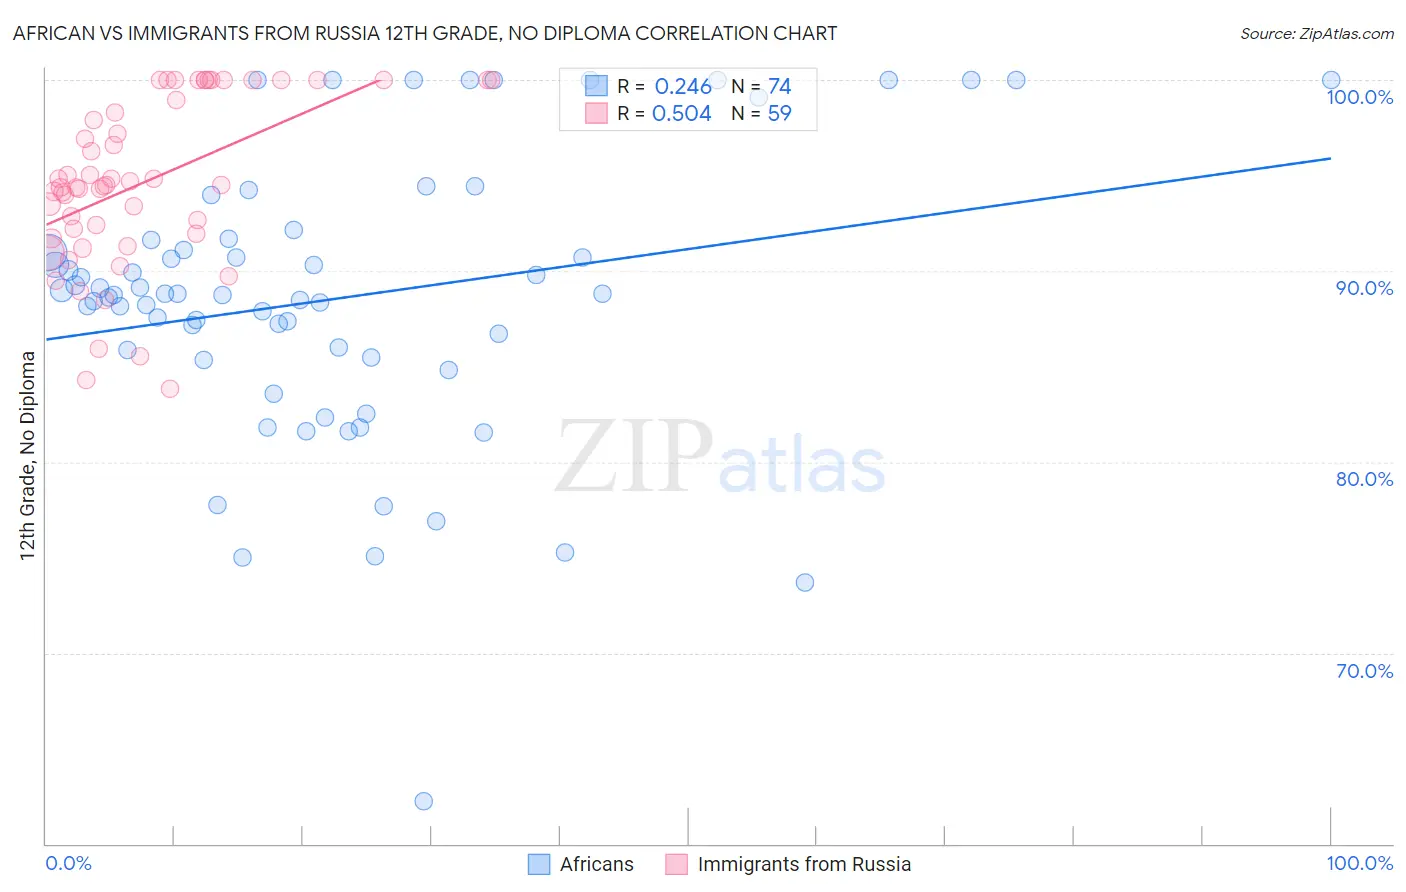
African vs Immigrants from Russia 12th Grade, No Diploma Correlation Chart
The statistical analysis conducted on geographies consisting of 470,094,658 people shows a weak positive correlation between the proportion of Africans and percentage of population with at least 12th grade (no diploma) education in the United States with a correlation coefficient (R) of 0.246 and weighted average of 89.6%. Similarly, the statistical analysis conducted on geographies consisting of 347,948,494 people shows a substantial positive correlation between the proportion of Immigrants from Russia and percentage of population with at least 12th grade (no diploma) education in the United States with a correlation coefficient (R) of 0.504 and weighted average of 92.2%, a difference of 2.8%.
12th Grade, No Diploma Correlation Summary
| Measurement | African | Immigrants from Russia |
| Minimum | 62.2% | 83.8% |
| Maximum | 100.0% | 100.0% |
| Range | 37.8% | 16.2% |
| Mean | 88.6% | 94.7% |
| Median | 88.8% | 94.5% |
| Interquartile 25% (IQ1) | 85.4% | 92.0% |
| Interquartile 75% (IQ3) | 91.6% | 100.0% |
| Interquartile Range (IQR) | 6.2% | 8.0% |
| Standard Deviation (Sample) | 7.4% | 4.4% |
| Standard Deviation (Population) | 7.3% | 4.3% |
Similar Demographics by 12th Grade, No Diploma
Demographics Similar to Africans by 12th Grade, No Diploma
In terms of 12th grade, no diploma, the demographic groups most similar to Africans are Immigrants from Western Africa (89.6%, a difference of 0.020%), Immigrants from South Eastern Asia (89.6%, a difference of 0.040%), Cheyenne (89.6%, a difference of 0.040%), Sioux (89.6%, a difference of 0.040%), and Immigrants from Ghana (89.7%, a difference of 0.050%).
| Demographics | Rating | Rank | 12th Grade, No Diploma |
| Spanish Americans | 0.9 /100 | #251 | Tragic 89.9% |
| Bahamians | 0.9 /100 | #252 | Tragic 89.9% |
| Choctaw | 0.7 /100 | #253 | Tragic 89.8% |
| Immigrants | Peru | 0.5 /100 | #254 | Tragic 89.7% |
| Immigrants | Senegal | 0.5 /100 | #255 | Tragic 89.7% |
| Immigrants | Ghana | 0.5 /100 | #256 | Tragic 89.7% |
| Jamaicans | 0.5 /100 | #257 | Tragic 89.7% |
| Africans | 0.4 /100 | #258 | Tragic 89.6% |
| Immigrants | Western Africa | 0.4 /100 | #259 | Tragic 89.6% |
| Immigrants | South Eastern Asia | 0.4 /100 | #260 | Tragic 89.6% |
| Cheyenne | 0.4 /100 | #261 | Tragic 89.6% |
| Sioux | 0.4 /100 | #262 | Tragic 89.6% |
| Immigrants | Jamaica | 0.2 /100 | #263 | Tragic 89.5% |
| Sri Lankans | 0.2 /100 | #264 | Tragic 89.4% |
| Trinidadians and Tobagonians | 0.2 /100 | #265 | Tragic 89.4% |
Demographics Similar to Immigrants from Russia by 12th Grade, No Diploma
In terms of 12th grade, no diploma, the demographic groups most similar to Immigrants from Russia are Immigrants from Belarus (92.2%, a difference of 0.010%), Syrian (92.2%, a difference of 0.010%), Jordanian (92.2%, a difference of 0.010%), Lebanese (92.2%, a difference of 0.030%), and Immigrants from Hungary (92.1%, a difference of 0.030%).
| Demographics | Rating | Rank | 12th Grade, No Diploma |
| Immigrants | Korea | 98.3 /100 | #99 | Exceptional 92.3% |
| Immigrants | Croatia | 98.3 /100 | #100 | Exceptional 92.3% |
| Swiss | 98.1 /100 | #101 | Exceptional 92.3% |
| Alaskan Athabascans | 98.1 /100 | #102 | Exceptional 92.3% |
| Immigrants | Norway | 98.1 /100 | #103 | Exceptional 92.3% |
| Lebanese | 97.6 /100 | #104 | Exceptional 92.2% |
| Immigrants | Belarus | 97.4 /100 | #105 | Exceptional 92.2% |
| Immigrants | Russia | 97.3 /100 | #106 | Exceptional 92.2% |
| Syrians | 97.2 /100 | #107 | Exceptional 92.2% |
| Jordanians | 97.2 /100 | #108 | Exceptional 92.2% |
| Immigrants | Hungary | 97.0 /100 | #109 | Exceptional 92.1% |
| Palestinians | 97.0 /100 | #110 | Exceptional 92.1% |
| Immigrants | Greece | 96.9 /100 | #111 | Exceptional 92.1% |
| Israelis | 96.8 /100 | #112 | Exceptional 92.1% |
| Immigrants | Zimbabwe | 96.5 /100 | #113 | Exceptional 92.1% |