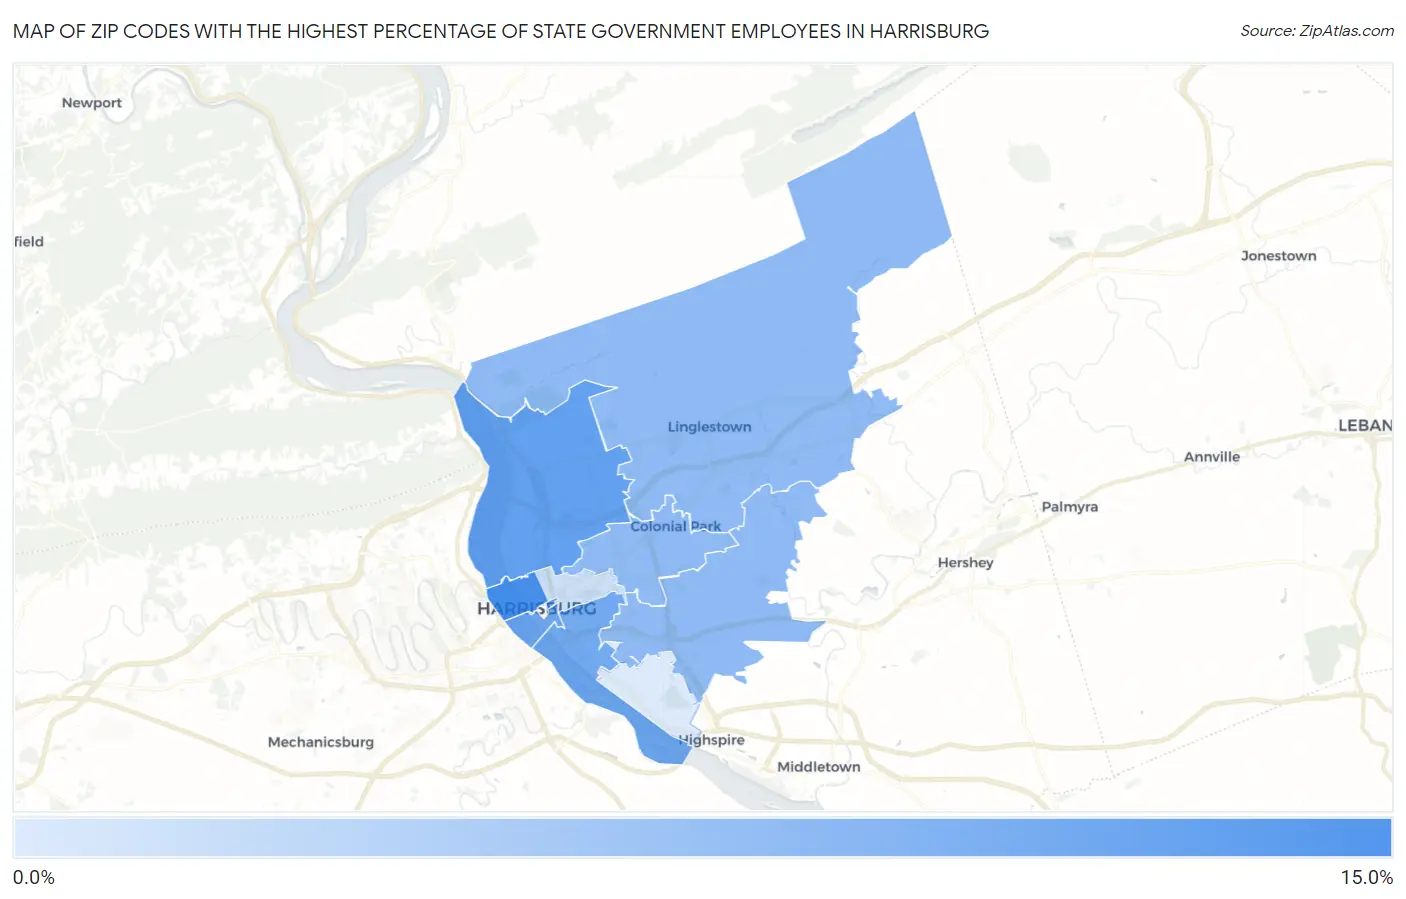
Zip Codes with the Highest Percentage of State Government Employees in Harrisburg, PA
RELATED REPORTS & OPTIONS
State Government Employees
Harrisburg
Compare Zip Codes
Map of Zip Codes with the Highest Percentage of State Government Employees in Harrisburg
4.3%
12.8%
Zip Codes with the Highest Percentage of State Government Employees in Harrisburg, PA
| Zip Code | % State Government Employees | vs State | vs National | |
| 1. | 17102 | 12.8% | 3.1%(+9.74)#89 | 4.2%(+8.58)#2,367 |
| 2. | 17110 | 11.2% | 3.1%(+8.10)#118 | 4.2%(+6.94)#3,119 |
| 3. | 17101 | 10.5% | 3.1%(+7.45)#133 | 4.2%(+6.29)#3,511 |
| 4. | 17104 | 10.2% | 3.1%(+7.15)#139 | 4.2%(+5.99)#3,728 |
| 5. | 17111 | 8.7% | 3.1%(+5.66)#184 | 4.2%(+4.51)#4,903 |
| 6. | 17112 | 8.7% | 3.1%(+5.64)#187 | 4.2%(+4.49)#4,922 |
| 7. | 17109 | 8.7% | 3.1%(+5.58)#190 | 4.2%(+4.43)#5,000 |
| 8. | 17103 | 5.2% | 3.1%(+2.16)#437 | 4.2%(+1.00)#10,337 |
| 9. | 17113 | 4.3% | 3.1%(+1.26)#524 | 4.2%(+0.104)#12,742 |
1
Common Questions
What are the Top 5 Zip Codes with the Highest Percentage of State Government Employees in Harrisburg, PA?
Top 5 Zip Codes with the Highest Percentage of State Government Employees in Harrisburg, PA are:
What zip code has the Highest Percentage of State Government Employees in Harrisburg, PA?
17102 has the Highest Percentage of State Government Employees in Harrisburg, PA with 12.8%.
What is the Percentage of State Government Employees in Harrisburg, PA?
Percentage of State Government Employees in Harrisburg is 9.6%.
What is the Percentage of State Government Employees in Pennsylvania?
Percentage of State Government Employees in Pennsylvania is 3.1%.
What is the Percentage of State Government Employees in the United States?
Percentage of State Government Employees in the United States is 4.2%.