Zimbabwean vs Egyptian In Labor Force | Age 45-54
COMPARE
Zimbabwean
Egyptian
In Labor Force | Age 45-54
In Labor Force | Age 45-54 Comparison
Zimbabweans
Egyptians
84.0%
IN LABOR FORCE | AGE 45-54
99.9/ 100
METRIC RATING
17th/ 347
METRIC RANK
83.5%
IN LABOR FORCE | AGE 45-54
97.9/ 100
METRIC RATING
65th/ 347
METRIC RANK
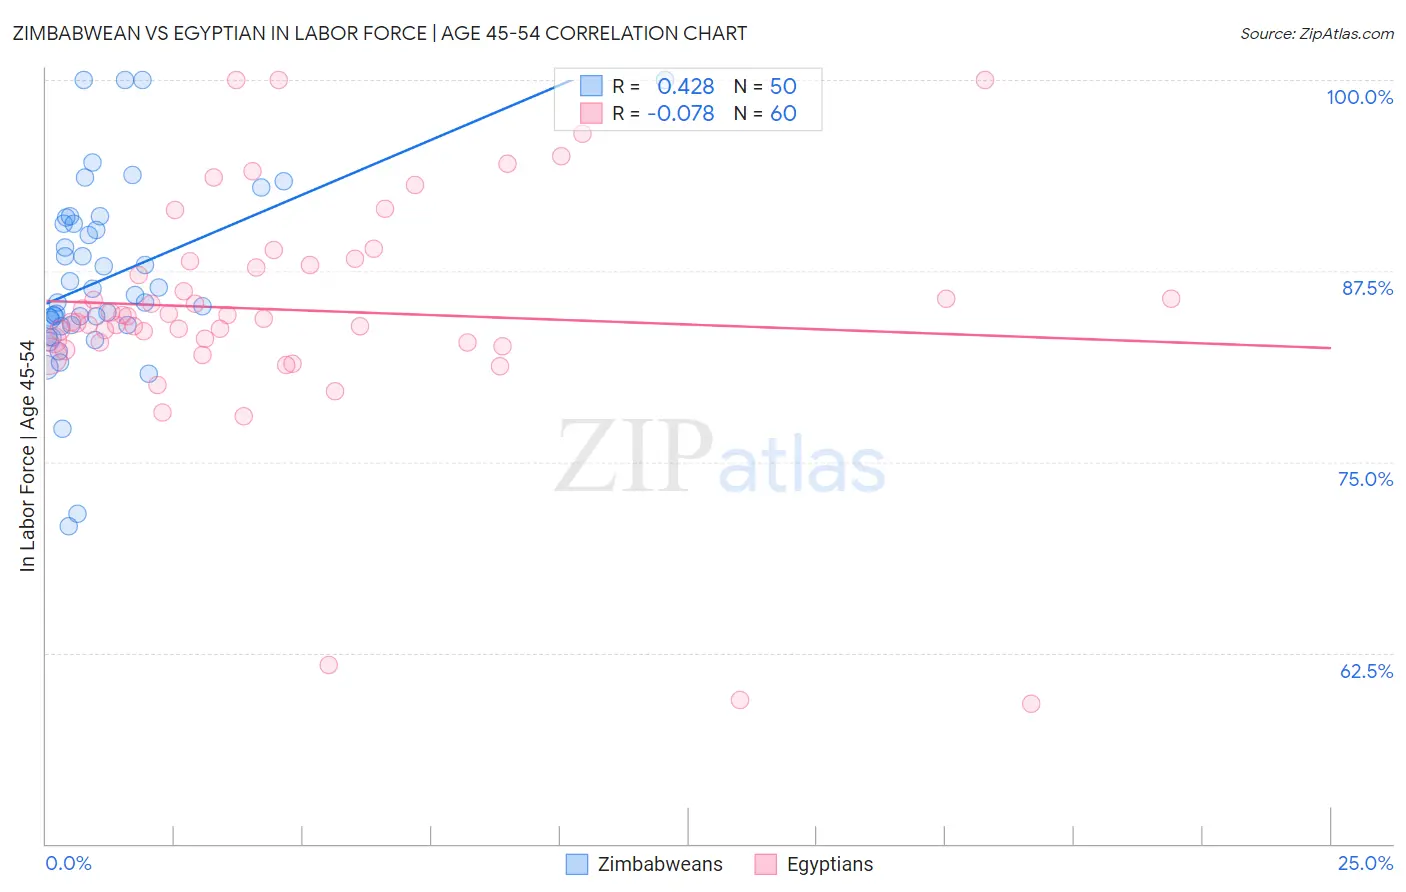
Zimbabwean vs Egyptian In Labor Force | Age 45-54 Correlation Chart
The statistical analysis conducted on geographies consisting of 69,187,806 people shows a moderate positive correlation between the proportion of Zimbabweans and labor force participation rate among population between the ages 45 and 54 in the United States with a correlation coefficient (R) of 0.428 and weighted average of 84.0%. Similarly, the statistical analysis conducted on geographies consisting of 276,763,301 people shows a slight negative correlation between the proportion of Egyptians and labor force participation rate among population between the ages 45 and 54 in the United States with a correlation coefficient (R) of -0.078 and weighted average of 83.5%, a difference of 0.68%.
In Labor Force | Age 45-54 Correlation Summary
| Measurement | Zimbabwean | Egyptian |
| Minimum | 70.8% | 59.2% |
| Maximum | 100.0% | 100.0% |
| Range | 29.2% | 40.8% |
| Mean | 87.0% | 84.9% |
| Median | 85.7% | 84.5% |
| Interquartile 25% (IQ1) | 84.0% | 82.8% |
| Interquartile 75% (IQ3) | 90.6% | 88.0% |
| Interquartile Range (IQR) | 6.6% | 5.2% |
| Standard Deviation (Sample) | 6.2% | 7.7% |
| Standard Deviation (Population) | 6.1% | 7.6% |
Similar Demographics by In Labor Force | Age 45-54
Demographics Similar to Zimbabweans by In Labor Force | Age 45-54
In terms of in labor force | age 45-54, the demographic groups most similar to Zimbabweans are Immigrants from South Central Asia (84.0%, a difference of 0.0%), Immigrants from Nepal (84.0%, a difference of 0.020%), Cypriot (84.1%, a difference of 0.040%), Cambodian (84.1%, a difference of 0.10%), and Czech (83.9%, a difference of 0.11%).
| Demographics | Rating | Rank | In Labor Force | Age 45-54 |
| Norwegians | 100.0 /100 | #10 | Exceptional 84.4% |
| Thais | 100.0 /100 | #11 | Exceptional 84.3% |
| Bulgarians | 100.0 /100 | #12 | Exceptional 84.2% |
| Chinese | 99.9 /100 | #13 | Exceptional 84.1% |
| Cambodians | 99.9 /100 | #14 | Exceptional 84.1% |
| Cypriots | 99.9 /100 | #15 | Exceptional 84.1% |
| Immigrants | Nepal | 99.9 /100 | #16 | Exceptional 84.0% |
| Zimbabweans | 99.9 /100 | #17 | Exceptional 84.0% |
| Immigrants | South Central Asia | 99.9 /100 | #18 | Exceptional 84.0% |
| Czechs | 99.8 /100 | #19 | Exceptional 83.9% |
| Immigrants | Eastern Africa | 99.8 /100 | #20 | Exceptional 83.9% |
| Immigrants | Sri Lanka | 99.8 /100 | #21 | Exceptional 83.9% |
| Immigrants | Ireland | 99.8 /100 | #22 | Exceptional 83.9% |
| Tlingit-Haida | 99.8 /100 | #23 | Exceptional 83.9% |
| Slovenes | 99.8 /100 | #24 | Exceptional 83.9% |
Demographics Similar to Egyptians by In Labor Force | Age 45-54
In terms of in labor force | age 45-54, the demographic groups most similar to Egyptians are Immigrants from Kenya (83.5%, a difference of 0.0%), Afghan (83.5%, a difference of 0.010%), Asian (83.4%, a difference of 0.010%), Chilean (83.4%, a difference of 0.010%), and Immigrants from Taiwan (83.5%, a difference of 0.020%).
| Demographics | Rating | Rank | In Labor Force | Age 45-54 |
| Eastern Europeans | 98.5 /100 | #58 | Exceptional 83.5% |
| Bhutanese | 98.3 /100 | #59 | Exceptional 83.5% |
| Carpatho Rusyns | 98.3 /100 | #60 | Exceptional 83.5% |
| Filipinos | 98.3 /100 | #61 | Exceptional 83.5% |
| Immigrants | Taiwan | 98.0 /100 | #62 | Exceptional 83.5% |
| Afghans | 97.9 /100 | #63 | Exceptional 83.5% |
| Immigrants | Kenya | 97.9 /100 | #64 | Exceptional 83.5% |
| Egyptians | 97.9 /100 | #65 | Exceptional 83.5% |
| Asians | 97.7 /100 | #66 | Exceptional 83.4% |
| Chileans | 97.7 /100 | #67 | Exceptional 83.4% |
| Immigrants | Colombia | 97.6 /100 | #68 | Exceptional 83.4% |
| Taiwanese | 97.5 /100 | #69 | Exceptional 83.4% |
| Immigrants | Latvia | 97.4 /100 | #70 | Exceptional 83.4% |
| Colombians | 97.3 /100 | #71 | Exceptional 83.4% |
| Serbians | 97.2 /100 | #72 | Exceptional 83.4% |