Zimbabwean vs Canadian In Labor Force | Age 45-54
COMPARE
Zimbabwean
Canadian
In Labor Force | Age 45-54
In Labor Force | Age 45-54 Comparison
Zimbabweans
Canadians
84.0%
IN LABOR FORCE | AGE 45-54
99.9/ 100
METRIC RATING
17th/ 347
METRIC RANK
82.4%
IN LABOR FORCE | AGE 45-54
15.1/ 100
METRIC RATING
201st/ 347
METRIC RANK
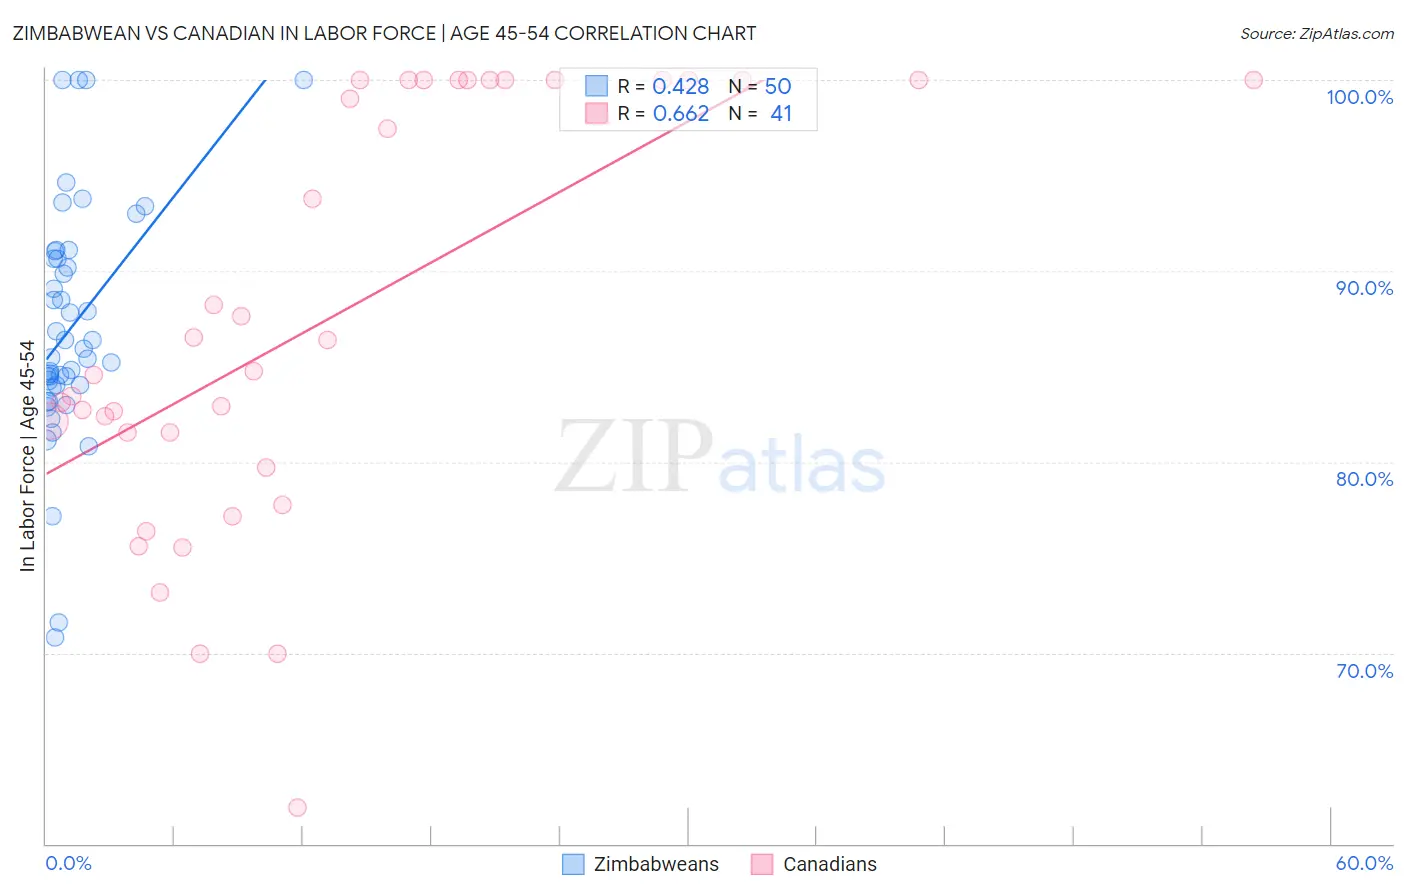
Zimbabwean vs Canadian In Labor Force | Age 45-54 Correlation Chart
The statistical analysis conducted on geographies consisting of 69,187,806 people shows a moderate positive correlation between the proportion of Zimbabweans and labor force participation rate among population between the ages 45 and 54 in the United States with a correlation coefficient (R) of 0.428 and weighted average of 84.0%. Similarly, the statistical analysis conducted on geographies consisting of 437,259,773 people shows a significant positive correlation between the proportion of Canadians and labor force participation rate among population between the ages 45 and 54 in the United States with a correlation coefficient (R) of 0.662 and weighted average of 82.4%, a difference of 1.9%.
In Labor Force | Age 45-54 Correlation Summary
| Measurement | Zimbabwean | Canadian |
| Minimum | 70.8% | 61.9% |
| Maximum | 100.0% | 100.0% |
| Range | 29.2% | 38.1% |
| Mean | 87.0% | 87.5% |
| Median | 85.7% | 84.7% |
| Interquartile 25% (IQ1) | 84.0% | 80.6% |
| Interquartile 75% (IQ3) | 90.6% | 100.0% |
| Interquartile Range (IQR) | 6.6% | 19.4% |
| Standard Deviation (Sample) | 6.2% | 10.8% |
| Standard Deviation (Population) | 6.1% | 10.7% |
Similar Demographics by In Labor Force | Age 45-54
Demographics Similar to Zimbabweans by In Labor Force | Age 45-54
In terms of in labor force | age 45-54, the demographic groups most similar to Zimbabweans are Immigrants from South Central Asia (84.0%, a difference of 0.0%), Immigrants from Nepal (84.0%, a difference of 0.020%), Cypriot (84.1%, a difference of 0.040%), Cambodian (84.1%, a difference of 0.10%), and Czech (83.9%, a difference of 0.11%).
| Demographics | Rating | Rank | In Labor Force | Age 45-54 |
| Norwegians | 100.0 /100 | #10 | Exceptional 84.4% |
| Thais | 100.0 /100 | #11 | Exceptional 84.3% |
| Bulgarians | 100.0 /100 | #12 | Exceptional 84.2% |
| Chinese | 99.9 /100 | #13 | Exceptional 84.1% |
| Cambodians | 99.9 /100 | #14 | Exceptional 84.1% |
| Cypriots | 99.9 /100 | #15 | Exceptional 84.1% |
| Immigrants | Nepal | 99.9 /100 | #16 | Exceptional 84.0% |
| Zimbabweans | 99.9 /100 | #17 | Exceptional 84.0% |
| Immigrants | South Central Asia | 99.9 /100 | #18 | Exceptional 84.0% |
| Czechs | 99.8 /100 | #19 | Exceptional 83.9% |
| Immigrants | Eastern Africa | 99.8 /100 | #20 | Exceptional 83.9% |
| Immigrants | Sri Lanka | 99.8 /100 | #21 | Exceptional 83.9% |
| Immigrants | Ireland | 99.8 /100 | #22 | Exceptional 83.9% |
| Tlingit-Haida | 99.8 /100 | #23 | Exceptional 83.9% |
| Slovenes | 99.8 /100 | #24 | Exceptional 83.9% |
Demographics Similar to Canadians by In Labor Force | Age 45-54
In terms of in labor force | age 45-54, the demographic groups most similar to Canadians are Immigrants from Western Asia (82.4%, a difference of 0.0%), Moroccan (82.5%, a difference of 0.010%), French Canadian (82.5%, a difference of 0.010%), Lebanese (82.5%, a difference of 0.050%), and Immigrants from Denmark (82.5%, a difference of 0.050%).
| Demographics | Rating | Rank | In Labor Force | Age 45-54 |
| Immigrants | Norway | 20.7 /100 | #194 | Fair 82.5% |
| Immigrants | Canada | 20.0 /100 | #195 | Fair 82.5% |
| Immigrants | North America | 18.8 /100 | #196 | Poor 82.5% |
| Lebanese | 18.2 /100 | #197 | Poor 82.5% |
| Immigrants | Denmark | 17.9 /100 | #198 | Poor 82.5% |
| Moroccans | 15.7 /100 | #199 | Poor 82.5% |
| French Canadians | 15.4 /100 | #200 | Poor 82.5% |
| Canadians | 15.1 /100 | #201 | Poor 82.4% |
| Immigrants | Western Asia | 14.9 /100 | #202 | Poor 82.4% |
| Arabs | 11.6 /100 | #203 | Poor 82.4% |
| Immigrants | Western Europe | 10.9 /100 | #204 | Poor 82.4% |
| Senegalese | 9.5 /100 | #205 | Tragic 82.4% |
| Welsh | 9.2 /100 | #206 | Tragic 82.3% |
| Immigrants | Cabo Verde | 8.6 /100 | #207 | Tragic 82.3% |
| Native Hawaiians | 8.5 /100 | #208 | Tragic 82.3% |