Zimbabwean vs Immigrants from Mexico In Labor Force | Age 45-54
COMPARE
Zimbabwean
Immigrants from Mexico
In Labor Force | Age 45-54
In Labor Force | Age 45-54 Comparison
Zimbabweans
Immigrants from Mexico
84.0%
IN LABOR FORCE | AGE 45-54
99.9/ 100
METRIC RATING
17th/ 347
METRIC RANK
79.7%
IN LABOR FORCE | AGE 45-54
0.0/ 100
METRIC RATING
312th/ 347
METRIC RANK
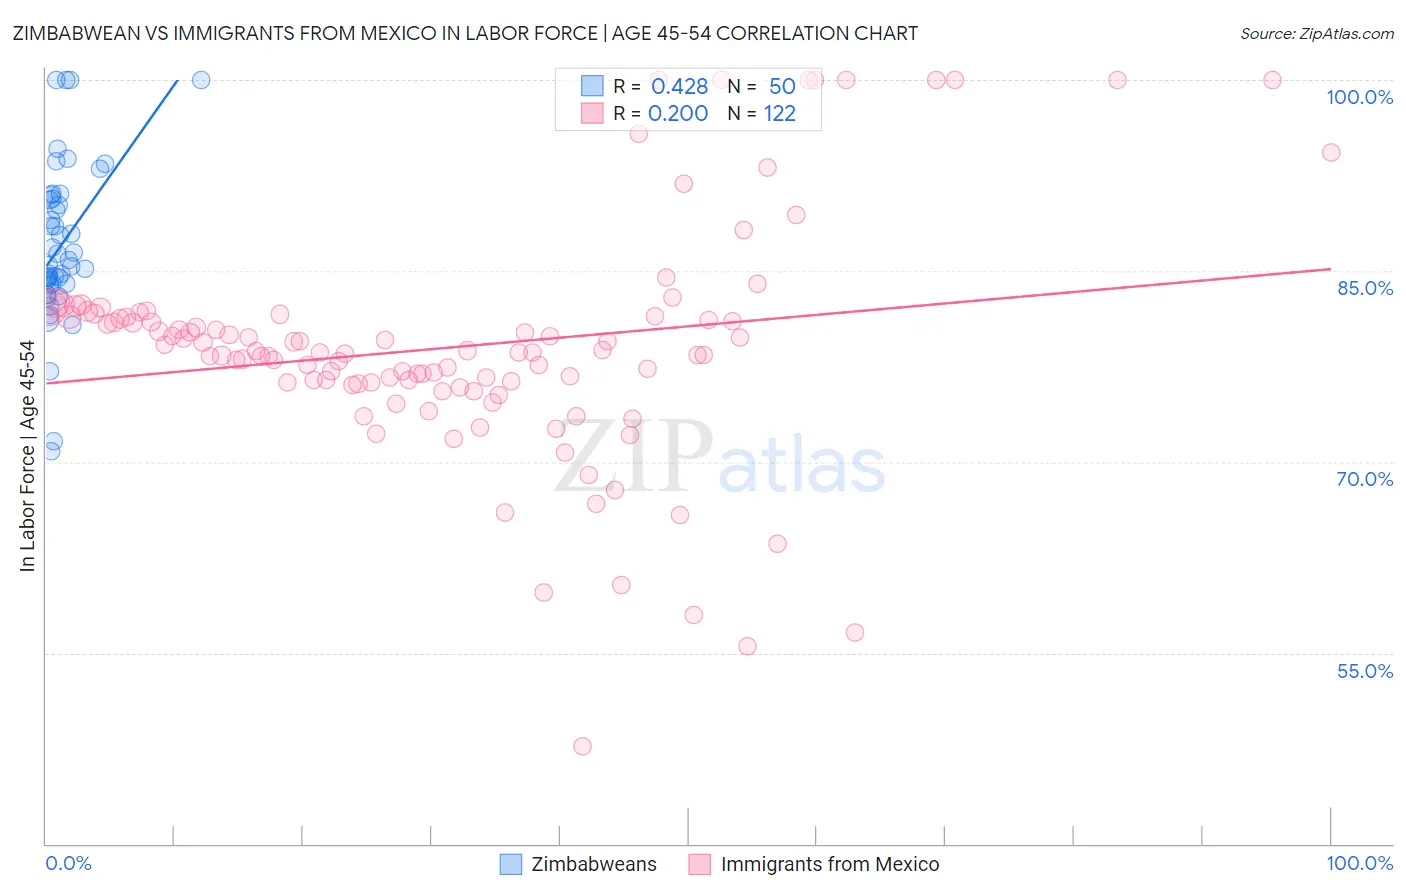
Zimbabwean vs Immigrants from Mexico In Labor Force | Age 45-54 Correlation Chart
The statistical analysis conducted on geographies consisting of 69,187,806 people shows a moderate positive correlation between the proportion of Zimbabweans and labor force participation rate among population between the ages 45 and 54 in the United States with a correlation coefficient (R) of 0.428 and weighted average of 84.0%. Similarly, the statistical analysis conducted on geographies consisting of 513,319,268 people shows a poor positive correlation between the proportion of Immigrants from Mexico and labor force participation rate among population between the ages 45 and 54 in the United States with a correlation coefficient (R) of 0.200 and weighted average of 79.7%, a difference of 5.5%.
In Labor Force | Age 45-54 Correlation Summary
| Measurement | Zimbabwean | Immigrants from Mexico |
| Minimum | 70.8% | 47.6% |
| Maximum | 100.0% | 100.0% |
| Range | 29.2% | 52.4% |
| Mean | 87.0% | 79.0% |
| Median | 85.7% | 78.6% |
| Interquartile 25% (IQ1) | 84.0% | 76.2% |
| Interquartile 75% (IQ3) | 90.6% | 81.4% |
| Interquartile Range (IQR) | 6.6% | 5.2% |
| Standard Deviation (Sample) | 6.2% | 9.1% |
| Standard Deviation (Population) | 6.1% | 9.1% |
Similar Demographics by In Labor Force | Age 45-54
Demographics Similar to Zimbabweans by In Labor Force | Age 45-54
In terms of in labor force | age 45-54, the demographic groups most similar to Zimbabweans are Immigrants from South Central Asia (84.0%, a difference of 0.0%), Immigrants from Nepal (84.0%, a difference of 0.020%), Cypriot (84.1%, a difference of 0.040%), Cambodian (84.1%, a difference of 0.10%), and Czech (83.9%, a difference of 0.11%).
| Demographics | Rating | Rank | In Labor Force | Age 45-54 |
| Norwegians | 100.0 /100 | #10 | Exceptional 84.4% |
| Thais | 100.0 /100 | #11 | Exceptional 84.3% |
| Bulgarians | 100.0 /100 | #12 | Exceptional 84.2% |
| Chinese | 99.9 /100 | #13 | Exceptional 84.1% |
| Cambodians | 99.9 /100 | #14 | Exceptional 84.1% |
| Cypriots | 99.9 /100 | #15 | Exceptional 84.1% |
| Immigrants | Nepal | 99.9 /100 | #16 | Exceptional 84.0% |
| Zimbabweans | 99.9 /100 | #17 | Exceptional 84.0% |
| Immigrants | South Central Asia | 99.9 /100 | #18 | Exceptional 84.0% |
| Czechs | 99.8 /100 | #19 | Exceptional 83.9% |
| Immigrants | Eastern Africa | 99.8 /100 | #20 | Exceptional 83.9% |
| Immigrants | Sri Lanka | 99.8 /100 | #21 | Exceptional 83.9% |
| Immigrants | Ireland | 99.8 /100 | #22 | Exceptional 83.9% |
| Tlingit-Haida | 99.8 /100 | #23 | Exceptional 83.9% |
| Slovenes | 99.8 /100 | #24 | Exceptional 83.9% |
Demographics Similar to Immigrants from Mexico by In Labor Force | Age 45-54
In terms of in labor force | age 45-54, the demographic groups most similar to Immigrants from Mexico are Mexican (79.8%, a difference of 0.14%), Colville (79.5%, a difference of 0.24%), Inupiat (79.9%, a difference of 0.25%), Ottawa (79.5%, a difference of 0.28%), and Potawatomi (80.0%, a difference of 0.34%).
| Demographics | Rating | Rank | In Labor Force | Age 45-54 |
| Immigrants | Dominican Republic | 0.0 /100 | #305 | Tragic 80.1% |
| Spanish Americans | 0.0 /100 | #306 | Tragic 80.1% |
| Blackfeet | 0.0 /100 | #307 | Tragic 80.0% |
| Central American Indians | 0.0 /100 | #308 | Tragic 80.0% |
| Potawatomi | 0.0 /100 | #309 | Tragic 80.0% |
| Inupiat | 0.0 /100 | #310 | Tragic 79.9% |
| Mexicans | 0.0 /100 | #311 | Tragic 79.8% |
| Immigrants | Mexico | 0.0 /100 | #312 | Tragic 79.7% |
| Colville | 0.0 /100 | #313 | Tragic 79.5% |
| Ottawa | 0.0 /100 | #314 | Tragic 79.5% |
| Blacks/African Americans | 0.0 /100 | #315 | Tragic 79.3% |
| Shoshone | 0.0 /100 | #316 | Tragic 79.3% |
| Comanche | 0.0 /100 | #317 | Tragic 79.2% |
| Chickasaw | 0.0 /100 | #318 | Tragic 79.0% |
| Cherokee | 0.0 /100 | #319 | Tragic 79.0% |