Zimbabwean vs Immigrants from Netherlands Bachelor's Degree
COMPARE
Zimbabwean
Immigrants from Netherlands
Bachelor's Degree
Bachelor's Degree Comparison
Zimbabweans
Immigrants from Netherlands
43.3%
BACHELOR'S DEGREE
99.7/ 100
METRIC RATING
65th/ 347
METRIC RANK
43.3%
BACHELOR'S DEGREE
99.7/ 100
METRIC RATING
66th/ 347
METRIC RANK
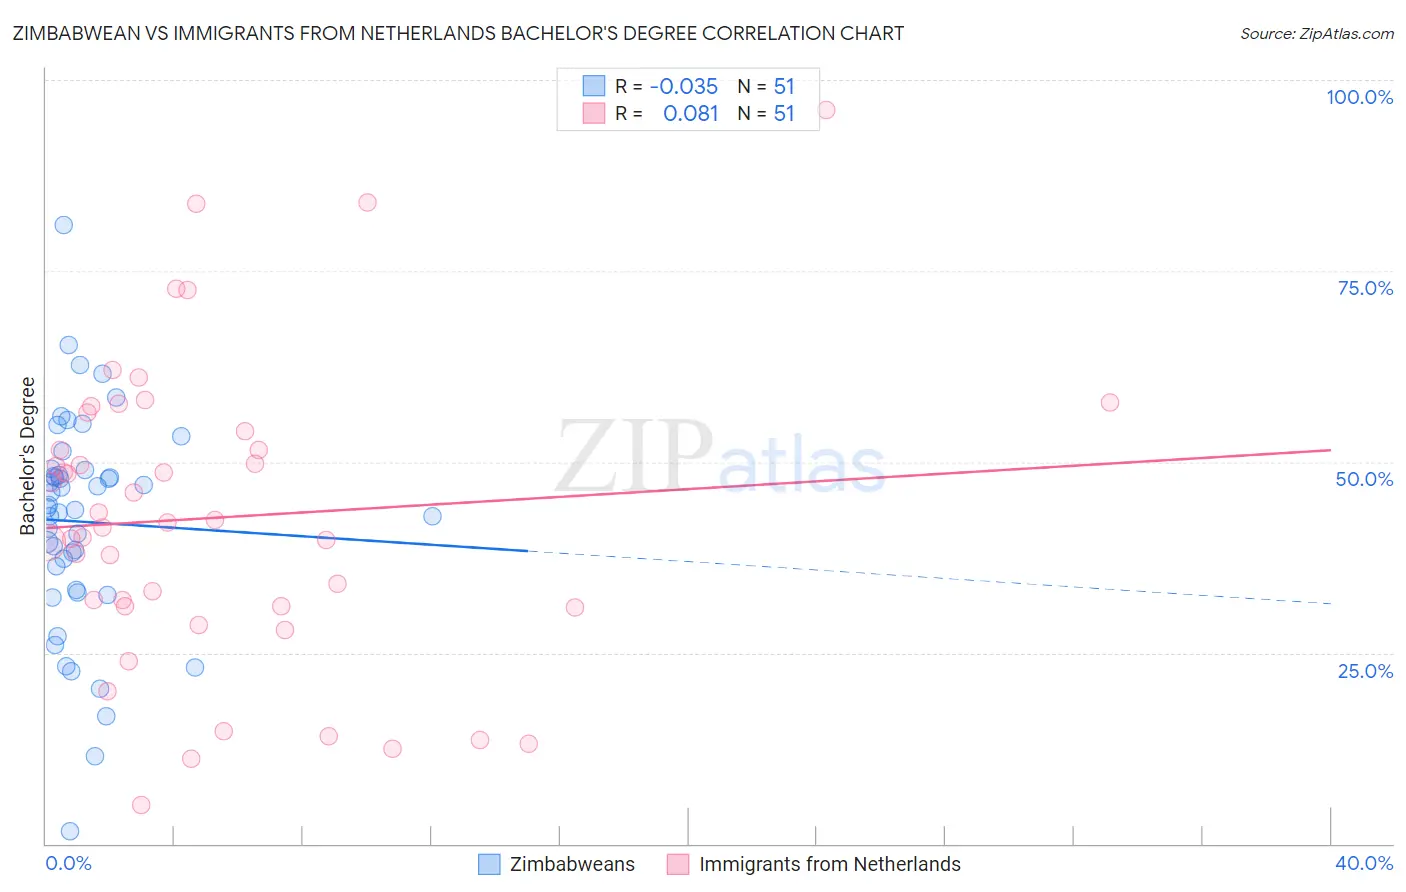
Zimbabwean vs Immigrants from Netherlands Bachelor's Degree Correlation Chart
The statistical analysis conducted on geographies consisting of 69,203,243 people shows no correlation between the proportion of Zimbabweans and percentage of population with at least bachelor's degree education in the United States with a correlation coefficient (R) of -0.035 and weighted average of 43.3%. Similarly, the statistical analysis conducted on geographies consisting of 237,874,454 people shows a slight positive correlation between the proportion of Immigrants from Netherlands and percentage of population with at least bachelor's degree education in the United States with a correlation coefficient (R) of 0.081 and weighted average of 43.3%, a difference of 0.020%.
Bachelor's Degree Correlation Summary
| Measurement | Zimbabwean | Immigrants from Netherlands |
| Minimum | 1.7% | 5.0% |
| Maximum | 81.0% | 96.1% |
| Range | 79.3% | 91.1% |
| Mean | 42.1% | 42.7% |
| Median | 44.0% | 42.1% |
| Interquartile 25% (IQ1) | 33.2% | 31.0% |
| Interquartile 75% (IQ3) | 49.0% | 54.0% |
| Interquartile Range (IQR) | 15.8% | 23.0% |
| Standard Deviation (Sample) | 14.3% | 19.6% |
| Standard Deviation (Population) | 14.1% | 19.4% |
Demographics Similar to Zimbabweans and Immigrants from Netherlands by Bachelor's Degree
In terms of bachelor's degree, the demographic groups most similar to Zimbabweans are Argentinean (43.3%, a difference of 0.0%), Egyptian (43.3%, a difference of 0.040%), Immigrants from Indonesia (43.3%, a difference of 0.060%), Immigrants from Europe (43.4%, a difference of 0.28%), and Immigrants from Kazakhstan (43.4%, a difference of 0.32%). Similarly, the demographic groups most similar to Immigrants from Netherlands are Argentinean (43.3%, a difference of 0.020%), Egyptian (43.3%, a difference of 0.020%), Immigrants from Indonesia (43.3%, a difference of 0.040%), Immigrants from Europe (43.4%, a difference of 0.30%), and Immigrants from Pakistan (43.1%, a difference of 0.30%).
| Demographics | Rating | Rank | Bachelor's Degree |
| Immigrants | Bolivia | 99.9 /100 | #55 | Exceptional 44.2% |
| Immigrants | Serbia | 99.9 /100 | #56 | Exceptional 44.1% |
| Paraguayans | 99.9 /100 | #57 | Exceptional 44.0% |
| Immigrants | Czechoslovakia | 99.9 /100 | #58 | Exceptional 44.0% |
| Australians | 99.9 /100 | #59 | Exceptional 44.0% |
| New Zealanders | 99.9 /100 | #60 | Exceptional 44.0% |
| South Africans | 99.8 /100 | #61 | Exceptional 43.6% |
| Immigrants | Kazakhstan | 99.8 /100 | #62 | Exceptional 43.4% |
| Immigrants | Europe | 99.8 /100 | #63 | Exceptional 43.4% |
| Argentineans | 99.7 /100 | #64 | Exceptional 43.3% |
| Zimbabweans | 99.7 /100 | #65 | Exceptional 43.3% |
| Immigrants | Netherlands | 99.7 /100 | #66 | Exceptional 43.3% |
| Egyptians | 99.7 /100 | #67 | Exceptional 43.3% |
| Immigrants | Indonesia | 99.7 /100 | #68 | Exceptional 43.3% |
| Immigrants | Pakistan | 99.7 /100 | #69 | Exceptional 43.1% |
| Immigrants | Romania | 99.6 /100 | #70 | Exceptional 42.9% |
| Immigrants | Argentina | 99.6 /100 | #71 | Exceptional 42.8% |
| Ethiopians | 99.5 /100 | #72 | Exceptional 42.8% |
| Immigrants | Uzbekistan | 99.5 /100 | #73 | Exceptional 42.8% |
| Bhutanese | 99.5 /100 | #74 | Exceptional 42.7% |
| Immigrants | Zimbabwe | 99.4 /100 | #75 | Exceptional 42.6% |