Zimbabwean vs Delaware In Labor Force | Age 20-64
COMPARE
Zimbabwean
Delaware
In Labor Force | Age 20-64
In Labor Force | Age 20-64 Comparison
Zimbabweans
Delaware
81.0%
IN LABOR FORCE | AGE 20-64
100.0/ 100
METRIC RATING
19th/ 347
METRIC RANK
77.8%
IN LABOR FORCE | AGE 20-64
0.0/ 100
METRIC RATING
293rd/ 347
METRIC RANK
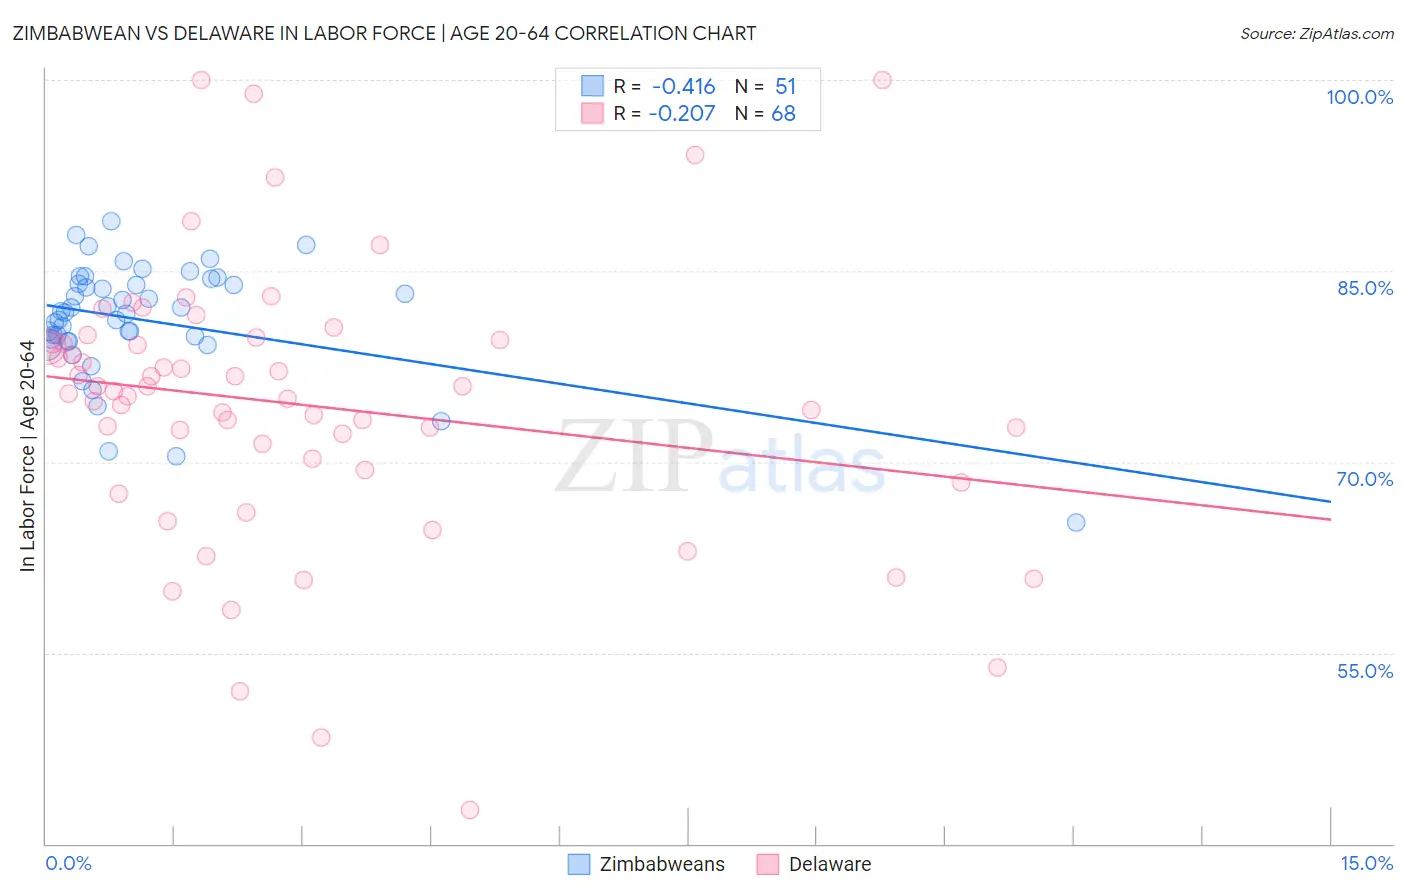
Zimbabwean vs Delaware In Labor Force | Age 20-64 Correlation Chart
The statistical analysis conducted on geographies consisting of 69,208,654 people shows a moderate negative correlation between the proportion of Zimbabweans and labor force participation rate among population between the ages 20 and 64 in the United States with a correlation coefficient (R) of -0.416 and weighted average of 81.0%. Similarly, the statistical analysis conducted on geographies consisting of 96,240,999 people shows a weak negative correlation between the proportion of Delaware and labor force participation rate among population between the ages 20 and 64 in the United States with a correlation coefficient (R) of -0.207 and weighted average of 77.8%, a difference of 4.1%.
In Labor Force | Age 20-64 Correlation Summary
| Measurement | Zimbabwean | Delaware |
| Minimum | 65.2% | 42.7% |
| Maximum | 88.9% | 100.0% |
| Range | 23.7% | 57.3% |
| Mean | 81.1% | 74.5% |
| Median | 81.7% | 75.4% |
| Interquartile 25% (IQ1) | 79.5% | 69.8% |
| Interquartile 75% (IQ3) | 84.0% | 79.5% |
| Interquartile Range (IQR) | 4.5% | 9.7% |
| Standard Deviation (Sample) | 4.5% | 10.9% |
| Standard Deviation (Population) | 4.5% | 10.8% |
Similar Demographics by In Labor Force | Age 20-64
Demographics Similar to Zimbabweans by In Labor Force | Age 20-64
In terms of in labor force | age 20-64, the demographic groups most similar to Zimbabweans are Immigrants from Bulgaria (81.0%, a difference of 0.0%), Norwegian (81.0%, a difference of 0.020%), Thai (80.9%, a difference of 0.050%), Liberian (80.9%, a difference of 0.070%), and Bulgarian (81.1%, a difference of 0.12%).
| Demographics | Rating | Rank | In Labor Force | Age 20-64 |
| Immigrants | Eritrea | 100.0 /100 | #12 | Exceptional 81.3% |
| Immigrants | India | 100.0 /100 | #13 | Exceptional 81.3% |
| Cambodians | 100.0 /100 | #14 | Exceptional 81.1% |
| Bulgarians | 100.0 /100 | #15 | Exceptional 81.1% |
| Immigrants | Nepal | 100.0 /100 | #16 | Exceptional 81.1% |
| Norwegians | 100.0 /100 | #17 | Exceptional 81.0% |
| Immigrants | Bulgaria | 100.0 /100 | #18 | Exceptional 81.0% |
| Zimbabweans | 100.0 /100 | #19 | Exceptional 81.0% |
| Thais | 100.0 /100 | #20 | Exceptional 80.9% |
| Liberians | 100.0 /100 | #21 | Exceptional 80.9% |
| Sudanese | 100.0 /100 | #22 | Exceptional 80.8% |
| Immigrants | Bosnia and Herzegovina | 100.0 /100 | #23 | Exceptional 80.8% |
| Immigrants | Morocco | 100.0 /100 | #24 | Exceptional 80.8% |
| Kenyans | 100.0 /100 | #25 | Exceptional 80.8% |
| Immigrants | Serbia | 100.0 /100 | #26 | Exceptional 80.8% |
Demographics Similar to Delaware by In Labor Force | Age 20-64
In terms of in labor force | age 20-64, the demographic groups most similar to Delaware are Immigrants from the Azores (77.8%, a difference of 0.040%), Spanish American (77.8%, a difference of 0.090%), Immigrants from Central America (77.7%, a difference of 0.090%), Immigrants from Grenada (77.7%, a difference of 0.12%), and Immigrants from Bangladesh (77.9%, a difference of 0.14%).
| Demographics | Rating | Rank | In Labor Force | Age 20-64 |
| Immigrants | Belize | 0.0 /100 | #286 | Tragic 78.0% |
| Vietnamese | 0.0 /100 | #287 | Tragic 78.0% |
| Hmong | 0.0 /100 | #288 | Tragic 77.9% |
| Africans | 0.0 /100 | #289 | Tragic 77.9% |
| Immigrants | Bangladesh | 0.0 /100 | #290 | Tragic 77.9% |
| Spanish Americans | 0.0 /100 | #291 | Tragic 77.8% |
| Immigrants | Azores | 0.0 /100 | #292 | Tragic 77.8% |
| Delaware | 0.0 /100 | #293 | Tragic 77.8% |
| Immigrants | Central America | 0.0 /100 | #294 | Tragic 77.7% |
| Immigrants | Grenada | 0.0 /100 | #295 | Tragic 77.7% |
| Immigrants | Dominican Republic | 0.0 /100 | #296 | Tragic 77.7% |
| Dominicans | 0.0 /100 | #297 | Tragic 77.7% |
| Cree | 0.0 /100 | #298 | Tragic 77.7% |
| Hispanics or Latinos | 0.0 /100 | #299 | Tragic 77.6% |
| Spanish American Indians | 0.0 /100 | #300 | Tragic 77.6% |