Yup'ik vs Dutch West Indian In Labor Force | Age 45-54
COMPARE
Yup'ik
Dutch West Indian
In Labor Force | Age 45-54
In Labor Force | Age 45-54 Comparison
Yup'ik
Dutch West Indians
78.6%
IN LABOR FORCE | AGE 45-54
0.0/ 100
METRIC RATING
321st/ 347
METRIC RANK
78.2%
IN LABOR FORCE | AGE 45-54
0.0/ 100
METRIC RATING
324th/ 347
METRIC RANK
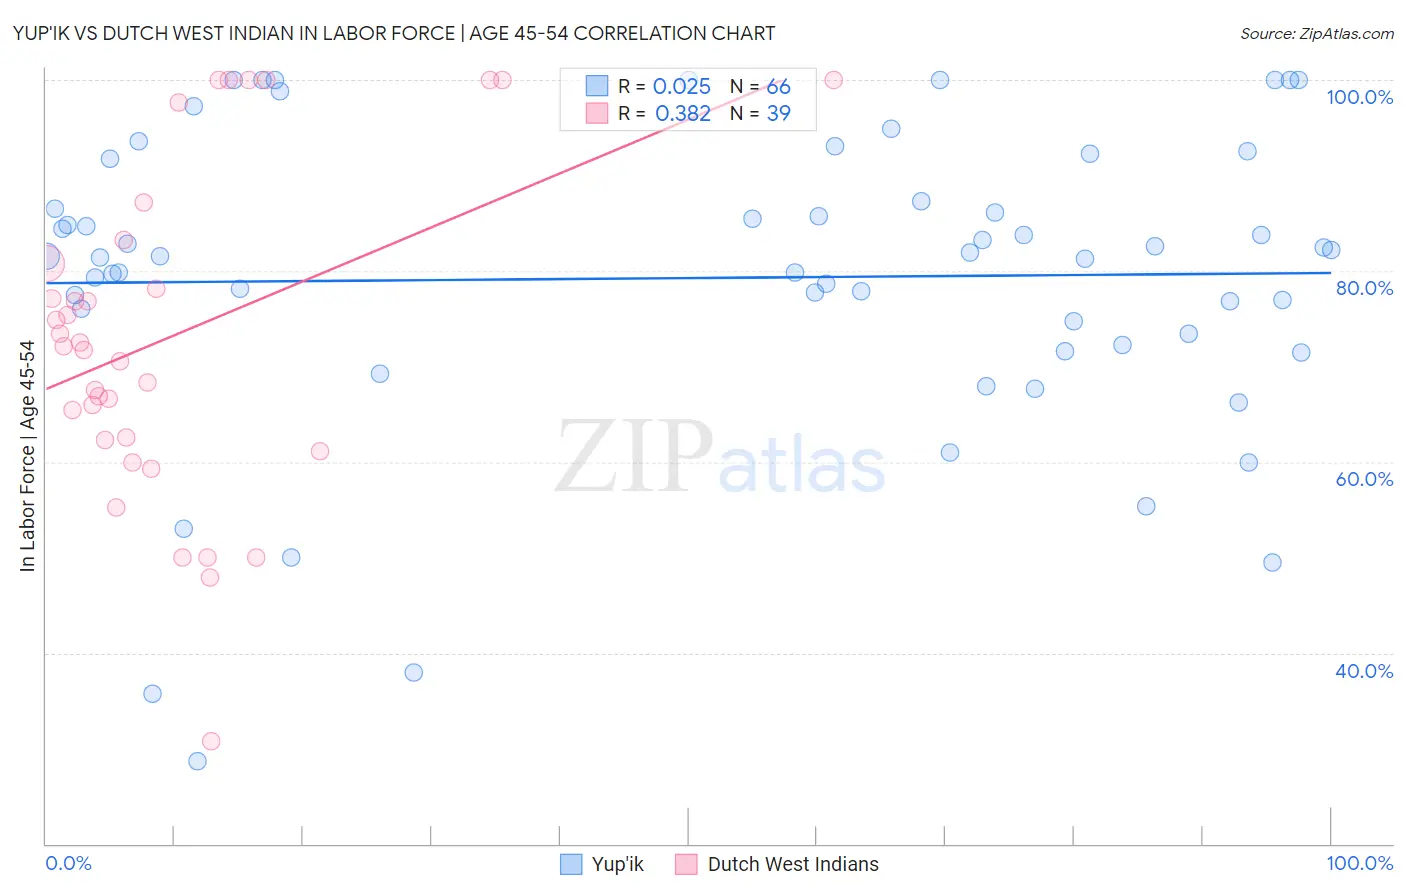
Yup'ik vs Dutch West Indian In Labor Force | Age 45-54 Correlation Chart
The statistical analysis conducted on geographies consisting of 39,957,049 people shows no correlation between the proportion of Yup'ik and labor force participation rate among population between the ages 45 and 54 in the United States with a correlation coefficient (R) of 0.025 and weighted average of 78.6%. Similarly, the statistical analysis conducted on geographies consisting of 85,763,377 people shows a mild positive correlation between the proportion of Dutch West Indians and labor force participation rate among population between the ages 45 and 54 in the United States with a correlation coefficient (R) of 0.382 and weighted average of 78.2%, a difference of 0.51%.
In Labor Force | Age 45-54 Correlation Summary
| Measurement | Yup'ik | Dutch West Indian |
| Minimum | 28.6% | 30.8% |
| Maximum | 100.0% | 100.0% |
| Range | 71.4% | 69.2% |
| Mean | 79.3% | 73.3% |
| Median | 81.5% | 72.2% |
| Interquartile 25% (IQ1) | 73.5% | 62.3% |
| Interquartile 75% (IQ3) | 87.3% | 83.3% |
| Interquartile Range (IQR) | 13.8% | 21.0% |
| Standard Deviation (Sample) | 15.9% | 17.4% |
| Standard Deviation (Population) | 15.8% | 17.1% |
Demographics Similar to Yup'ik and Dutch West Indians by In Labor Force | Age 45-54
In terms of in labor force | age 45-54, the demographic groups most similar to Yup'ik are Yaqui (78.9%, a difference of 0.30%), Cherokee (79.0%, a difference of 0.40%), Crow (78.3%, a difference of 0.41%), Kiowa (78.3%, a difference of 0.49%), and Chickasaw (79.0%, a difference of 0.51%). Similarly, the demographic groups most similar to Dutch West Indians are Kiowa (78.3%, a difference of 0.020%), Choctaw (78.2%, a difference of 0.090%), Crow (78.3%, a difference of 0.10%), Seminole (78.1%, a difference of 0.14%), and Cajun (78.1%, a difference of 0.15%).
| Demographics | Rating | Rank | In Labor Force | Age 45-54 |
| Immigrants | Mexico | 0.0 /100 | #312 | Tragic 79.7% |
| Colville | 0.0 /100 | #313 | Tragic 79.5% |
| Ottawa | 0.0 /100 | #314 | Tragic 79.5% |
| Blacks/African Americans | 0.0 /100 | #315 | Tragic 79.3% |
| Shoshone | 0.0 /100 | #316 | Tragic 79.3% |
| Comanche | 0.0 /100 | #317 | Tragic 79.2% |
| Chickasaw | 0.0 /100 | #318 | Tragic 79.0% |
| Cherokee | 0.0 /100 | #319 | Tragic 79.0% |
| Yaqui | 0.0 /100 | #320 | Tragic 78.9% |
| Yup'ik | 0.0 /100 | #321 | Tragic 78.6% |
| Crow | 0.0 /100 | #322 | Tragic 78.3% |
| Kiowa | 0.0 /100 | #323 | Tragic 78.3% |
| Dutch West Indians | 0.0 /100 | #324 | Tragic 78.2% |
| Choctaw | 0.0 /100 | #325 | Tragic 78.2% |
| Seminole | 0.0 /100 | #326 | Tragic 78.1% |
| Cajuns | 0.0 /100 | #327 | Tragic 78.1% |
| Sioux | 0.0 /100 | #328 | Tragic 78.0% |
| Creek | 0.0 /100 | #329 | Tragic 77.7% |
| Cheyenne | 0.0 /100 | #330 | Tragic 77.6% |
| Tsimshian | 0.0 /100 | #331 | Tragic 77.4% |
| Menominee | 0.0 /100 | #332 | Tragic 77.4% |