Nicaraguan vs Immigrants from Jordan In Labor Force | Age 16-19
COMPARE
Nicaraguan
Immigrants from Jordan
In Labor Force | Age 16-19
In Labor Force | Age 16-19 Comparison
Nicaraguans
Immigrants from Jordan
32.4%
IN LABOR FORCE | AGE 16-19
0.0/ 100
METRIC RATING
305th/ 347
METRIC RANK
36.9%
IN LABOR FORCE | AGE 16-19
69.5/ 100
METRIC RATING
162nd/ 347
METRIC RANK
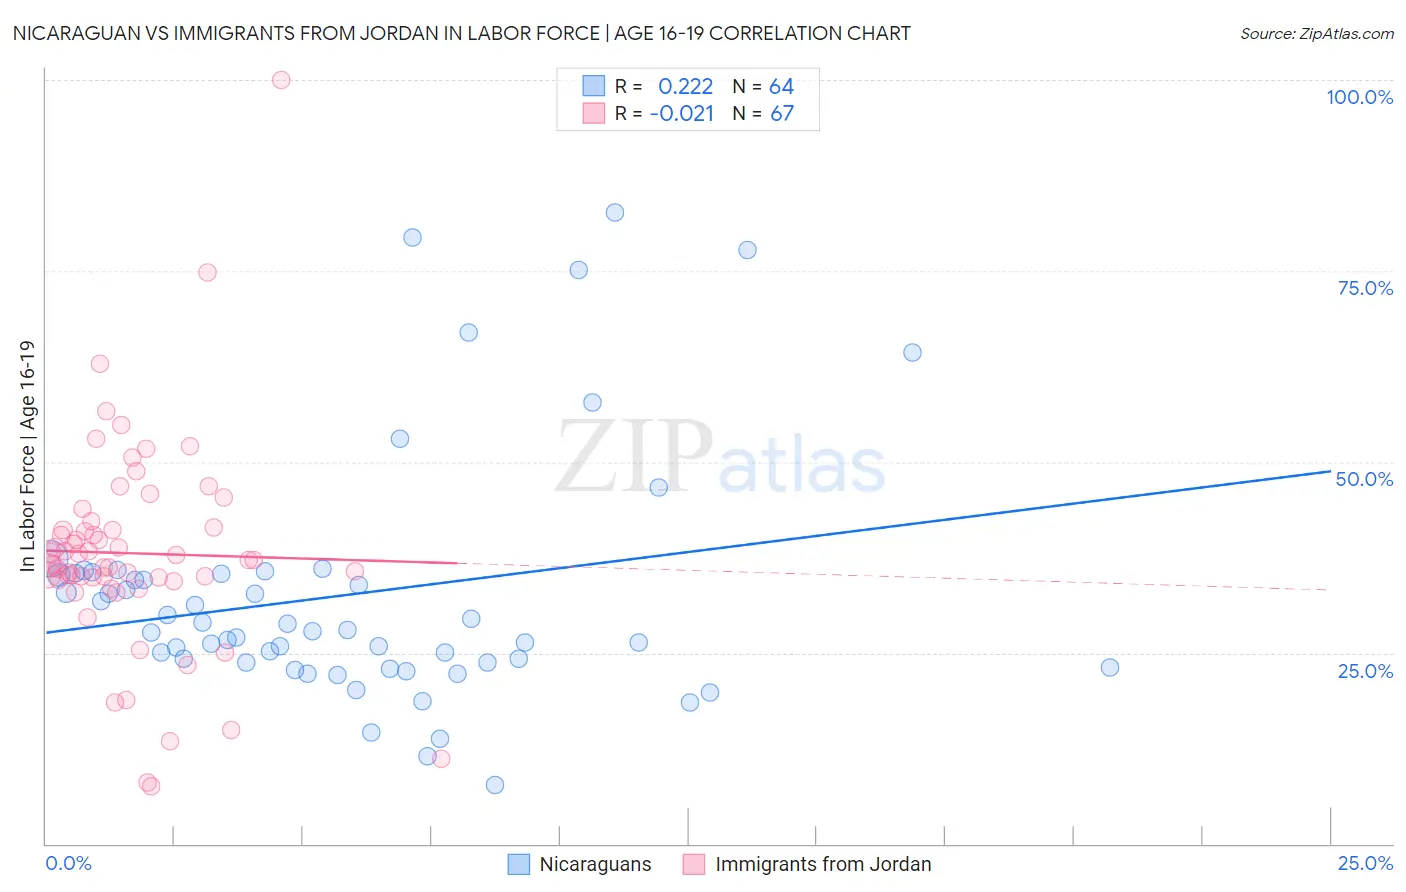
Nicaraguan vs Immigrants from Jordan In Labor Force | Age 16-19 Correlation Chart
The statistical analysis conducted on geographies consisting of 285,526,863 people shows a weak positive correlation between the proportion of Nicaraguans and labor force participation rate among population between the ages 16 and 19 in the United States with a correlation coefficient (R) of 0.222 and weighted average of 32.4%. Similarly, the statistical analysis conducted on geographies consisting of 181,222,099 people shows no correlation between the proportion of Immigrants from Jordan and labor force participation rate among population between the ages 16 and 19 in the United States with a correlation coefficient (R) of -0.021 and weighted average of 36.9%, a difference of 14.1%.
In Labor Force | Age 16-19 Correlation Summary
| Measurement | Nicaraguan | Immigrants from Jordan |
| Minimum | 7.7% | 7.6% |
| Maximum | 82.6% | 100.0% |
| Range | 74.9% | 92.4% |
| Mean | 32.6% | 38.0% |
| Median | 27.9% | 37.2% |
| Interquartile 25% (IQ1) | 23.7% | 34.6% |
| Interquartile 75% (IQ3) | 35.4% | 41.4% |
| Interquartile Range (IQR) | 11.7% | 6.8% |
| Standard Deviation (Sample) | 16.0% | 14.0% |
| Standard Deviation (Population) | 15.9% | 13.9% |
Similar Demographics by In Labor Force | Age 16-19
Demographics Similar to Nicaraguans by In Labor Force | Age 16-19
In terms of in labor force | age 16-19, the demographic groups most similar to Nicaraguans are Israeli (32.4%, a difference of 0.050%), Spanish American Indian (32.4%, a difference of 0.13%), Immigrants from Dominica (32.5%, a difference of 0.24%), Immigrants from Jamaica (32.2%, a difference of 0.62%), and Navajo (32.1%, a difference of 0.97%).
| Demographics | Rating | Rank | In Labor Force | Age 16-19 |
| Iranians | 0.0 /100 | #298 | Tragic 33.0% |
| Armenians | 0.0 /100 | #299 | Tragic 32.9% |
| Immigrants | Argentina | 0.0 /100 | #300 | Tragic 32.9% |
| Okinawans | 0.0 /100 | #301 | Tragic 32.8% |
| Belizeans | 0.0 /100 | #302 | Tragic 32.8% |
| Immigrants | Dominica | 0.0 /100 | #303 | Tragic 32.5% |
| Israelis | 0.0 /100 | #304 | Tragic 32.4% |
| Nicaraguans | 0.0 /100 | #305 | Tragic 32.4% |
| Spanish American Indians | 0.0 /100 | #306 | Tragic 32.4% |
| Immigrants | Jamaica | 0.0 /100 | #307 | Tragic 32.2% |
| Navajo | 0.0 /100 | #308 | Tragic 32.1% |
| Immigrants | Eastern Asia | 0.0 /100 | #309 | Tragic 32.0% |
| Immigrants | Iran | 0.0 /100 | #310 | Tragic 32.0% |
| Indians (Asian) | 0.0 /100 | #311 | Tragic 31.9% |
| Immigrants | Belize | 0.0 /100 | #312 | Tragic 31.8% |
Demographics Similar to Immigrants from Jordan by In Labor Force | Age 16-19
In terms of in labor force | age 16-19, the demographic groups most similar to Immigrants from Jordan are Bermudan (36.9%, a difference of 0.010%), Immigrants from Kuwait (36.9%, a difference of 0.040%), Cambodian (37.0%, a difference of 0.12%), Yakama (36.9%, a difference of 0.15%), and Immigrants from Western Africa (36.9%, a difference of 0.16%).
| Demographics | Rating | Rank | In Labor Force | Age 16-19 |
| Immigrants | Lithuania | 80.7 /100 | #155 | Excellent 37.2% |
| Kiowa | 80.4 /100 | #156 | Excellent 37.2% |
| Immigrants | Brazil | 76.5 /100 | #157 | Good 37.1% |
| Ute | 75.7 /100 | #158 | Good 37.1% |
| Yaqui | 74.4 /100 | #159 | Good 37.1% |
| Immigrants | Saudi Arabia | 73.9 /100 | #160 | Good 37.0% |
| Cambodians | 71.5 /100 | #161 | Good 37.0% |
| Immigrants | Jordan | 69.5 /100 | #162 | Good 36.9% |
| Bermudans | 69.3 /100 | #163 | Good 36.9% |
| Immigrants | Kuwait | 68.9 /100 | #164 | Good 36.9% |
| Yakama | 66.9 /100 | #165 | Good 36.9% |
| Immigrants | Western Africa | 66.7 /100 | #166 | Good 36.9% |
| Arabs | 63.6 /100 | #167 | Good 36.8% |
| Palestinians | 63.1 /100 | #168 | Good 36.8% |
| Immigrants | Latvia | 61.6 /100 | #169 | Good 36.8% |