Immigrants from Croatia vs Immigrants from Jordan In Labor Force | Age 16-19
COMPARE
Immigrants from Croatia
Immigrants from Jordan
In Labor Force | Age 16-19
In Labor Force | Age 16-19 Comparison
Immigrants from Croatia
Immigrants from Jordan
36.1%
IN LABOR FORCE | AGE 16-19
27.5/ 100
METRIC RATING
191st/ 347
METRIC RANK
36.9%
IN LABOR FORCE | AGE 16-19
69.5/ 100
METRIC RATING
162nd/ 347
METRIC RANK
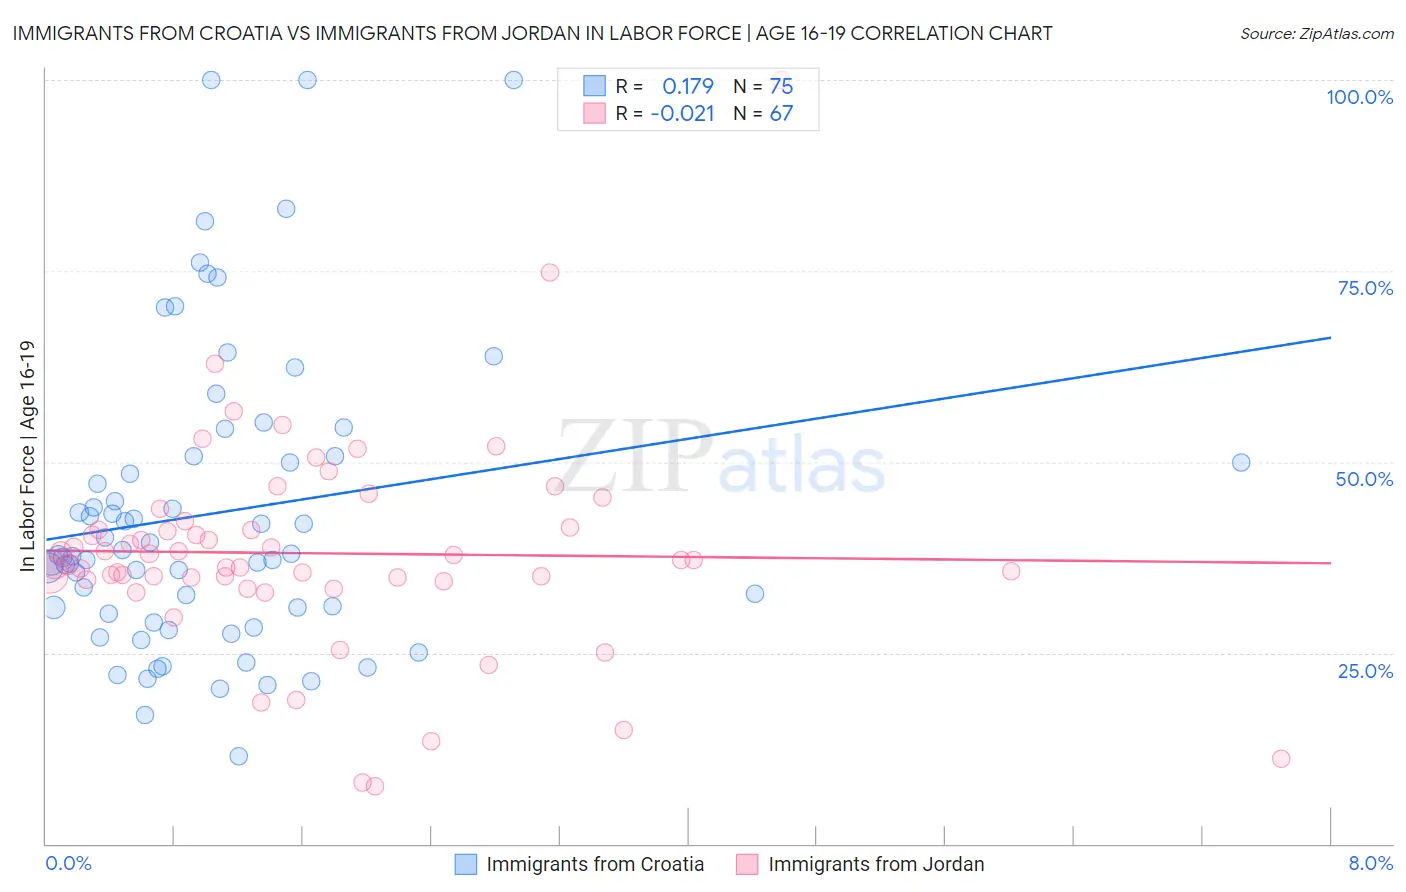
Immigrants from Croatia vs Immigrants from Jordan In Labor Force | Age 16-19 Correlation Chart
The statistical analysis conducted on geographies consisting of 132,497,839 people shows a poor positive correlation between the proportion of Immigrants from Croatia and labor force participation rate among population between the ages 16 and 19 in the United States with a correlation coefficient (R) of 0.179 and weighted average of 36.1%. Similarly, the statistical analysis conducted on geographies consisting of 181,222,099 people shows no correlation between the proportion of Immigrants from Jordan and labor force participation rate among population between the ages 16 and 19 in the United States with a correlation coefficient (R) of -0.021 and weighted average of 36.9%, a difference of 2.3%.
In Labor Force | Age 16-19 Correlation Summary
| Measurement | Immigrants from Croatia | Immigrants from Jordan |
| Minimum | 11.5% | 7.6% |
| Maximum | 100.0% | 100.0% |
| Range | 88.5% | 92.4% |
| Mean | 43.3% | 38.0% |
| Median | 37.8% | 37.2% |
| Interquartile 25% (IQ1) | 30.1% | 34.6% |
| Interquartile 75% (IQ3) | 50.7% | 41.4% |
| Interquartile Range (IQR) | 20.6% | 6.8% |
| Standard Deviation (Sample) | 19.6% | 14.0% |
| Standard Deviation (Population) | 19.5% | 13.9% |
Similar Demographics by In Labor Force | Age 16-19
Demographics Similar to Immigrants from Croatia by In Labor Force | Age 16-19
In terms of in labor force | age 16-19, the demographic groups most similar to Immigrants from Croatia are Panamanian (36.1%, a difference of 0.070%), Immigrants from Hungary (36.2%, a difference of 0.080%), Afghan (36.1%, a difference of 0.12%), Immigrants from Denmark (36.1%, a difference of 0.17%), and Nigerian (36.1%, a difference of 0.19%).
| Demographics | Rating | Rank | In Labor Force | Age 16-19 |
| Costa Ricans | 36.1 /100 | #184 | Fair 36.3% |
| Bhutanese | 35.3 /100 | #185 | Fair 36.3% |
| Immigrants | Romania | 34.0 /100 | #186 | Fair 36.3% |
| Immigrants | Afghanistan | 34.0 /100 | #187 | Fair 36.3% |
| Immigrants | Europe | 31.8 /100 | #188 | Fair 36.2% |
| Immigrants | Hungary | 28.8 /100 | #189 | Fair 36.2% |
| Panamanians | 28.6 /100 | #190 | Fair 36.1% |
| Immigrants | Croatia | 27.5 /100 | #191 | Fair 36.1% |
| Afghans | 25.7 /100 | #192 | Fair 36.1% |
| Immigrants | Denmark | 25.0 /100 | #193 | Fair 36.1% |
| Nigerians | 24.6 /100 | #194 | Fair 36.1% |
| Bolivians | 23.3 /100 | #195 | Fair 36.0% |
| Mexican American Indians | 21.1 /100 | #196 | Fair 36.0% |
| Immigrants | Serbia | 21.0 /100 | #197 | Fair 36.0% |
| Immigrants | Northern Africa | 19.9 /100 | #198 | Poor 35.9% |
Demographics Similar to Immigrants from Jordan by In Labor Force | Age 16-19
In terms of in labor force | age 16-19, the demographic groups most similar to Immigrants from Jordan are Bermudan (36.9%, a difference of 0.010%), Immigrants from Kuwait (36.9%, a difference of 0.040%), Cambodian (37.0%, a difference of 0.12%), Yakama (36.9%, a difference of 0.15%), and Immigrants from Western Africa (36.9%, a difference of 0.16%).
| Demographics | Rating | Rank | In Labor Force | Age 16-19 |
| Immigrants | Lithuania | 80.7 /100 | #155 | Excellent 37.2% |
| Kiowa | 80.4 /100 | #156 | Excellent 37.2% |
| Immigrants | Brazil | 76.5 /100 | #157 | Good 37.1% |
| Ute | 75.7 /100 | #158 | Good 37.1% |
| Yaqui | 74.4 /100 | #159 | Good 37.1% |
| Immigrants | Saudi Arabia | 73.9 /100 | #160 | Good 37.0% |
| Cambodians | 71.5 /100 | #161 | Good 37.0% |
| Immigrants | Jordan | 69.5 /100 | #162 | Good 36.9% |
| Bermudans | 69.3 /100 | #163 | Good 36.9% |
| Immigrants | Kuwait | 68.9 /100 | #164 | Good 36.9% |
| Yakama | 66.9 /100 | #165 | Good 36.9% |
| Immigrants | Western Africa | 66.7 /100 | #166 | Good 36.9% |
| Arabs | 63.6 /100 | #167 | Good 36.8% |
| Palestinians | 63.1 /100 | #168 | Good 36.8% |
| Immigrants | Latvia | 61.6 /100 | #169 | Good 36.8% |