Immigrants from Syria vs Immigrants from Bulgaria In Labor Force | Age 16-19
COMPARE
Immigrants from Syria
Immigrants from Bulgaria
In Labor Force | Age 16-19
In Labor Force | Age 16-19 Comparison
Immigrants from Syria
Immigrants from Bulgaria
35.2%
IN LABOR FORCE | AGE 16-19
4.5/ 100
METRIC RATING
231st/ 347
METRIC RANK
37.3%
IN LABOR FORCE | AGE 16-19
81.6/ 100
METRIC RATING
154th/ 347
METRIC RANK
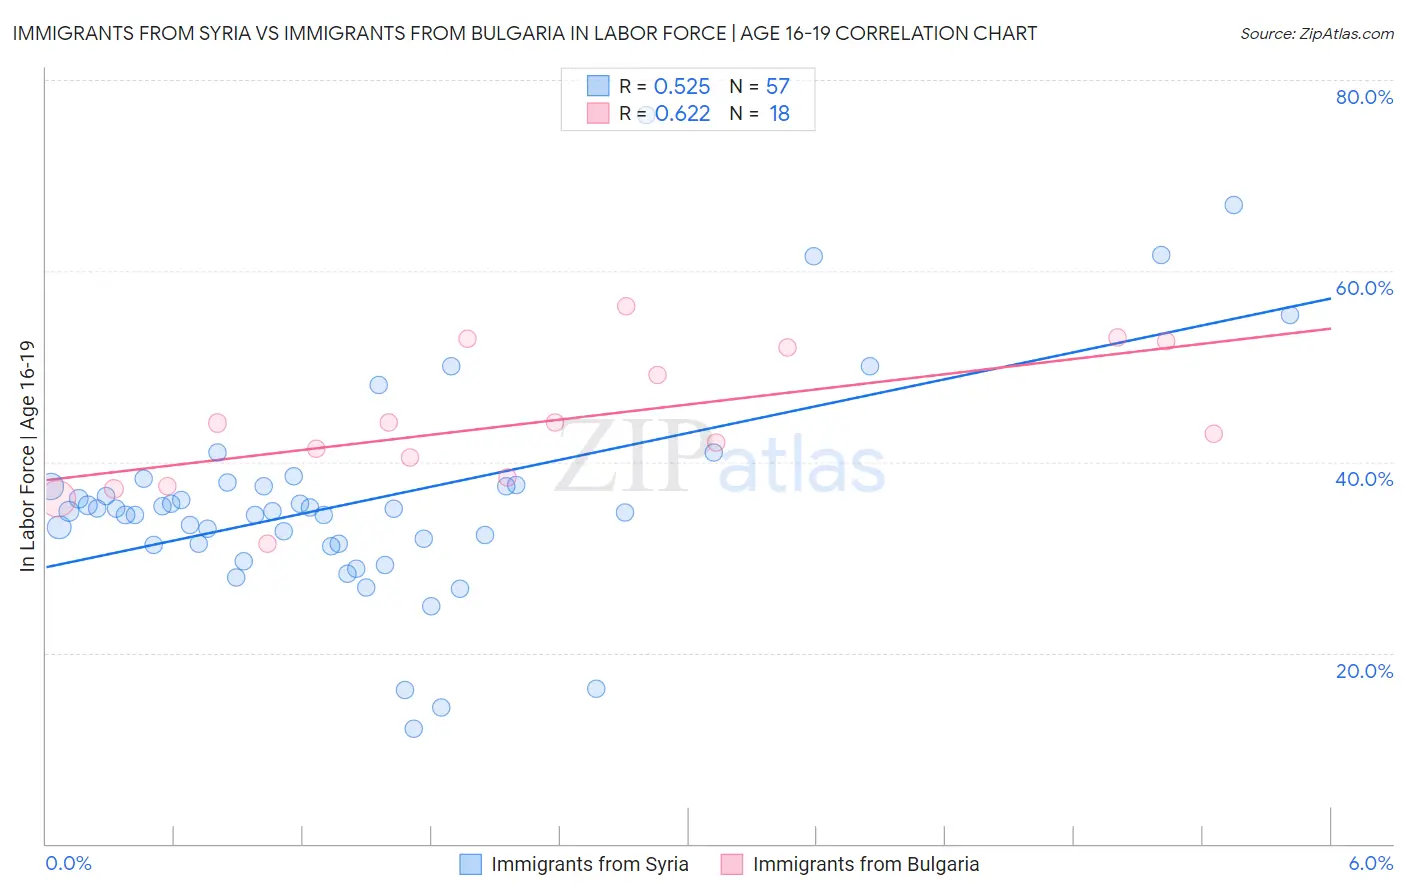
Immigrants from Syria vs Immigrants from Bulgaria In Labor Force | Age 16-19 Correlation Chart
The statistical analysis conducted on geographies consisting of 174,056,881 people shows a substantial positive correlation between the proportion of Immigrants from Syria and labor force participation rate among population between the ages 16 and 19 in the United States with a correlation coefficient (R) of 0.525 and weighted average of 35.2%. Similarly, the statistical analysis conducted on geographies consisting of 172,373,837 people shows a significant positive correlation between the proportion of Immigrants from Bulgaria and labor force participation rate among population between the ages 16 and 19 in the United States with a correlation coefficient (R) of 0.622 and weighted average of 37.3%, a difference of 5.9%.
In Labor Force | Age 16-19 Correlation Summary
| Measurement | Immigrants from Syria | Immigrants from Bulgaria |
| Minimum | 12.0% | 31.4% |
| Maximum | 76.3% | 56.3% |
| Range | 64.3% | 24.8% |
| Mean | 36.0% | 44.2% |
| Median | 34.9% | 43.5% |
| Interquartile 25% (IQ1) | 31.3% | 38.4% |
| Interquartile 75% (IQ3) | 37.5% | 52.0% |
| Interquartile Range (IQR) | 6.2% | 13.6% |
| Standard Deviation (Sample) | 11.5% | 7.0% |
| Standard Deviation (Population) | 11.4% | 6.8% |
Similar Demographics by In Labor Force | Age 16-19
Demographics Similar to Immigrants from Syria by In Labor Force | Age 16-19
In terms of in labor force | age 16-19, the demographic groups most similar to Immigrants from Syria are Immigrants from Kazakhstan (35.2%, a difference of 0.0%), Immigrants from France (35.1%, a difference of 0.040%), Immigrants from Mexico (35.1%, a difference of 0.080%), Immigrants from Honduras (35.2%, a difference of 0.12%), and Immigrants from Lebanon (35.2%, a difference of 0.15%).
| Demographics | Rating | Rank | In Labor Force | Age 16-19 |
| Hondurans | 6.5 /100 | #224 | Tragic 35.3% |
| Immigrants | Belgium | 6.1 /100 | #225 | Tragic 35.3% |
| Immigrants | Guatemala | 5.7 /100 | #226 | Tragic 35.3% |
| Mongolians | 5.7 /100 | #227 | Tragic 35.3% |
| Immigrants | Senegal | 5.5 /100 | #228 | Tragic 35.3% |
| Immigrants | Lebanon | 5.0 /100 | #229 | Tragic 35.2% |
| Immigrants | Honduras | 4.9 /100 | #230 | Tragic 35.2% |
| Immigrants | Syria | 4.5 /100 | #231 | Tragic 35.2% |
| Immigrants | Kazakhstan | 4.5 /100 | #232 | Tragic 35.2% |
| Immigrants | France | 4.3 /100 | #233 | Tragic 35.1% |
| Immigrants | Mexico | 4.2 /100 | #234 | Tragic 35.1% |
| Immigrants | Philippines | 4.0 /100 | #235 | Tragic 35.1% |
| Immigrants | Australia | 3.6 /100 | #236 | Tragic 35.1% |
| Immigrants | India | 3.5 /100 | #237 | Tragic 35.0% |
| Immigrants | Vietnam | 3.4 /100 | #238 | Tragic 35.0% |
Demographics Similar to Immigrants from Bulgaria by In Labor Force | Age 16-19
In terms of in labor force | age 16-19, the demographic groups most similar to Immigrants from Bulgaria are Arapaho (37.3%, a difference of 0.020%), Immigrants from Lithuania (37.2%, a difference of 0.070%), Kiowa (37.2%, a difference of 0.10%), Immigrants from Sierra Leone (37.3%, a difference of 0.17%), and Immigrants from Poland (37.3%, a difference of 0.25%).
| Demographics | Rating | Rank | In Labor Force | Age 16-19 |
| Brazilians | 88.7 /100 | #147 | Excellent 37.5% |
| Romanians | 87.3 /100 | #148 | Excellent 37.5% |
| Native Hawaiians | 85.0 /100 | #149 | Excellent 37.4% |
| Tsimshian | 84.7 /100 | #150 | Excellent 37.4% |
| Immigrants | Poland | 84.4 /100 | #151 | Excellent 37.3% |
| Immigrants | Sierra Leone | 83.6 /100 | #152 | Excellent 37.3% |
| Arapaho | 81.8 /100 | #153 | Excellent 37.3% |
| Immigrants | Bulgaria | 81.6 /100 | #154 | Excellent 37.3% |
| Immigrants | Lithuania | 80.7 /100 | #155 | Excellent 37.2% |
| Kiowa | 80.4 /100 | #156 | Excellent 37.2% |
| Immigrants | Brazil | 76.5 /100 | #157 | Good 37.1% |
| Ute | 75.7 /100 | #158 | Good 37.1% |
| Yaqui | 74.4 /100 | #159 | Good 37.1% |
| Immigrants | Saudi Arabia | 73.9 /100 | #160 | Good 37.0% |
| Cambodians | 71.5 /100 | #161 | Good 37.0% |