Yuman vs Immigrants from Thailand In Labor Force | Age 45-54
COMPARE
Yuman
Immigrants from Thailand
In Labor Force | Age 45-54
In Labor Force | Age 45-54 Comparison
Yuman
Immigrants from Thailand
76.3%
IN LABOR FORCE | AGE 45-54
0.0/ 100
METRIC RATING
338th/ 347
METRIC RANK
81.9%
IN LABOR FORCE | AGE 45-54
1.0/ 100
METRIC RATING
239th/ 347
METRIC RANK
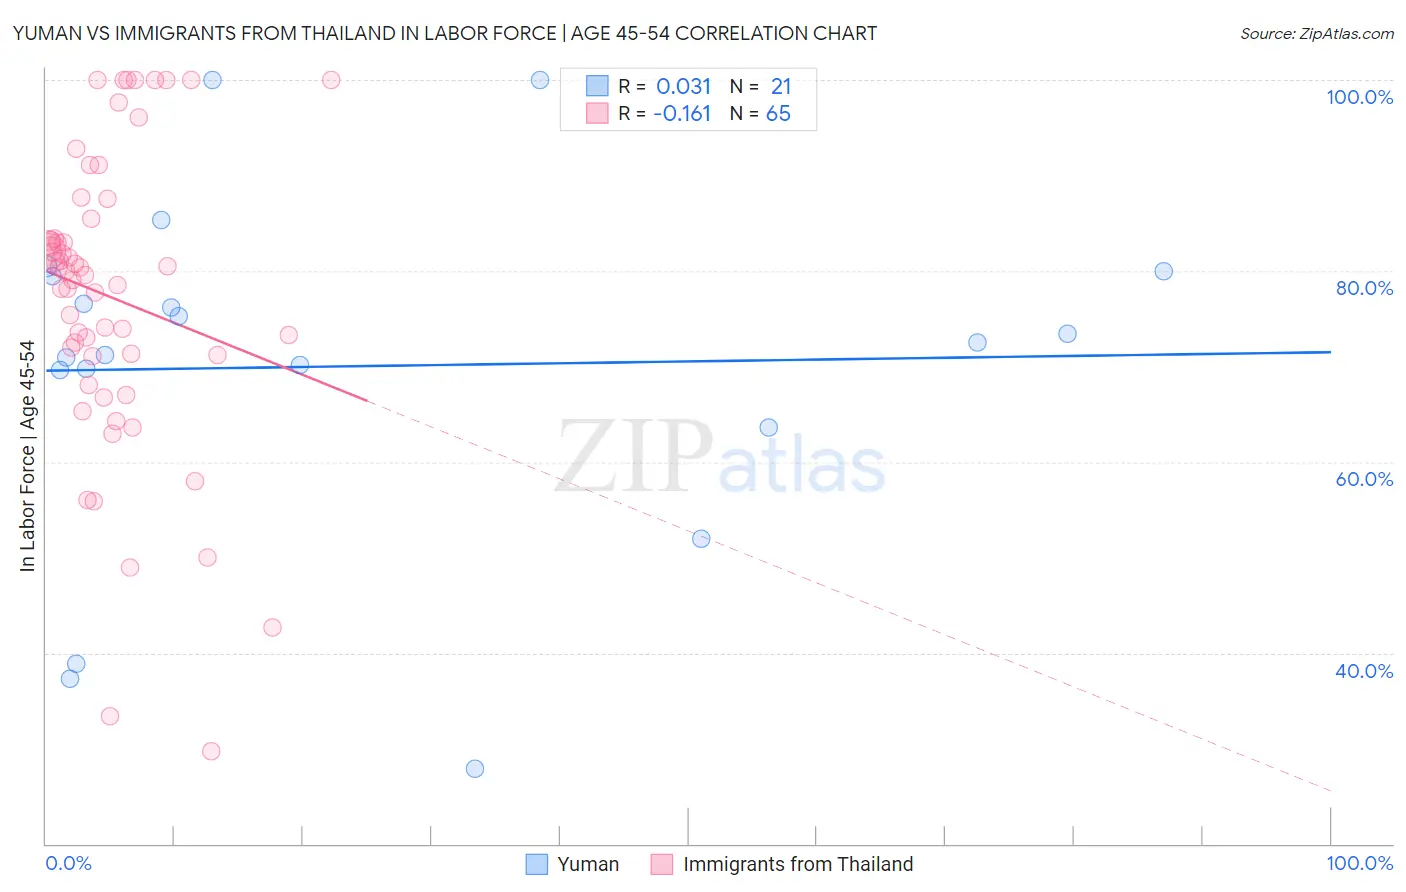
Yuman vs Immigrants from Thailand In Labor Force | Age 45-54 Correlation Chart
The statistical analysis conducted on geographies consisting of 40,663,251 people shows no correlation between the proportion of Yuman and labor force participation rate among population between the ages 45 and 54 in the United States with a correlation coefficient (R) of 0.031 and weighted average of 76.3%. Similarly, the statistical analysis conducted on geographies consisting of 316,914,814 people shows a poor negative correlation between the proportion of Immigrants from Thailand and labor force participation rate among population between the ages 45 and 54 in the United States with a correlation coefficient (R) of -0.161 and weighted average of 81.9%, a difference of 7.4%.
In Labor Force | Age 45-54 Correlation Summary
| Measurement | Yuman | Immigrants from Thailand |
| Minimum | 27.8% | 29.7% |
| Maximum | 100.0% | 100.0% |
| Range | 72.2% | 70.3% |
| Mean | 70.0% | 77.3% |
| Median | 72.5% | 80.0% |
| Interquartile 25% (IQ1) | 66.6% | 71.1% |
| Interquartile 75% (IQ3) | 79.7% | 84.4% |
| Interquartile Range (IQR) | 13.1% | 13.3% |
| Standard Deviation (Sample) | 18.2% | 15.6% |
| Standard Deviation (Population) | 17.8% | 15.5% |
Similar Demographics by In Labor Force | Age 45-54
Demographics Similar to Yuman by In Labor Force | Age 45-54
In terms of in labor force | age 45-54, the demographic groups most similar to Yuman are Ute (76.6%, a difference of 0.41%), Paiute (76.7%, a difference of 0.47%), Puerto Rican (75.9%, a difference of 0.48%), Lumbee (75.6%, a difference of 0.95%), and Arapaho (77.1%, a difference of 1.0%).
| Demographics | Rating | Rank | In Labor Force | Age 45-54 |
| Tsimshian | 0.0 /100 | #331 | Tragic 77.4% |
| Menominee | 0.0 /100 | #332 | Tragic 77.4% |
| Natives/Alaskans | 0.0 /100 | #333 | Tragic 77.1% |
| Apache | 0.0 /100 | #334 | Tragic 77.1% |
| Arapaho | 0.0 /100 | #335 | Tragic 77.1% |
| Paiute | 0.0 /100 | #336 | Tragic 76.7% |
| Ute | 0.0 /100 | #337 | Tragic 76.6% |
| Yuman | 0.0 /100 | #338 | Tragic 76.3% |
| Puerto Ricans | 0.0 /100 | #339 | Tragic 75.9% |
| Lumbee | 0.0 /100 | #340 | Tragic 75.6% |
| Pueblo | 0.0 /100 | #341 | Tragic 75.5% |
| Tohono O'odham | 0.0 /100 | #342 | Tragic 75.1% |
| Hopi | 0.0 /100 | #343 | Tragic 75.0% |
| Immigrants | Yemen | 0.0 /100 | #344 | Tragic 74.4% |
| Houma | 0.0 /100 | #345 | Tragic 74.1% |
Demographics Similar to Immigrants from Thailand by In Labor Force | Age 45-54
In terms of in labor force | age 45-54, the demographic groups most similar to Immigrants from Thailand are Immigrants from El Salvador (81.9%, a difference of 0.010%), Immigrants from Trinidad and Tobago (82.0%, a difference of 0.030%), Trinidadian and Tobagonian (81.9%, a difference of 0.030%), Subsaharan African (82.0%, a difference of 0.040%), and Basque (82.0%, a difference of 0.040%).
| Demographics | Rating | Rank | In Labor Force | Age 45-54 |
| Immigrants | Portugal | 1.7 /100 | #232 | Tragic 82.0% |
| Malaysians | 1.7 /100 | #233 | Tragic 82.0% |
| Salvadorans | 1.7 /100 | #234 | Tragic 82.0% |
| Sub-Saharan Africans | 1.2 /100 | #235 | Tragic 82.0% |
| Basques | 1.2 /100 | #236 | Tragic 82.0% |
| Immigrants | Trinidad and Tobago | 1.2 /100 | #237 | Tragic 82.0% |
| Trinidadians and Tobagonians | 1.1 /100 | #238 | Tragic 81.9% |
| Immigrants | Thailand | 1.0 /100 | #239 | Tragic 81.9% |
| Immigrants | El Salvador | 1.0 /100 | #240 | Tragic 81.9% |
| Immigrants | Cambodia | 0.8 /100 | #241 | Tragic 81.9% |
| Whites/Caucasians | 0.7 /100 | #242 | Tragic 81.9% |
| Samoans | 0.6 /100 | #243 | Tragic 81.8% |
| Celtics | 0.4 /100 | #244 | Tragic 81.8% |
| Alaska Natives | 0.4 /100 | #245 | Tragic 81.8% |
| Alaskan Athabascans | 0.4 /100 | #246 | Tragic 81.8% |