Yugoslavian vs Immigrants from Latin America In Labor Force | Age 45-54
COMPARE
Yugoslavian
Immigrants from Latin America
In Labor Force | Age 45-54
In Labor Force | Age 45-54 Comparison
Yugoslavians
Immigrants from Latin America
83.0%
IN LABOR FORCE | AGE 45-54
78.3/ 100
METRIC RATING
140th/ 347
METRIC RANK
81.0%
IN LABOR FORCE | AGE 45-54
0.0/ 100
METRIC RATING
280th/ 347
METRIC RANK
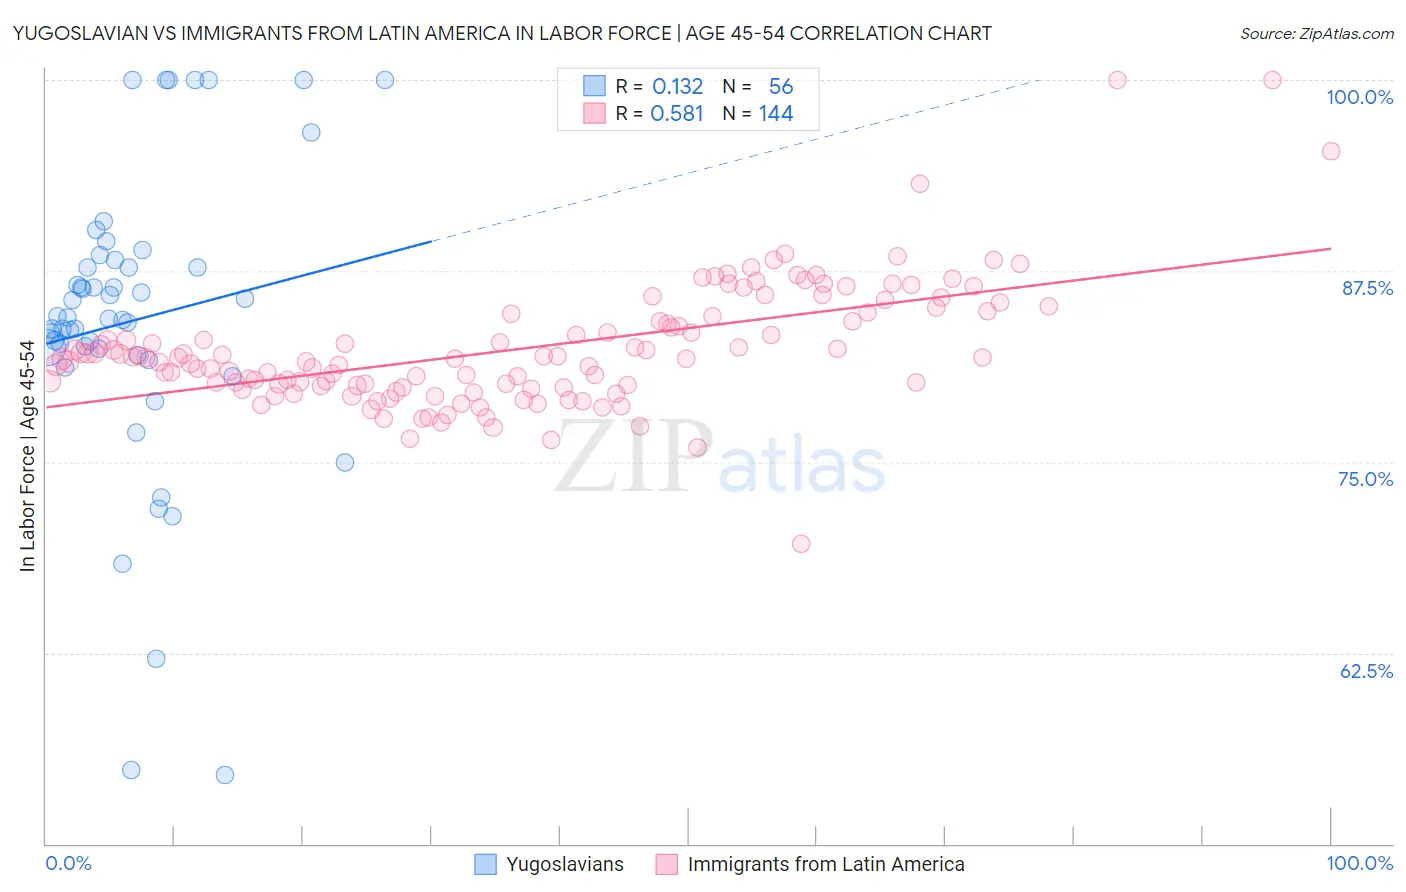
Yugoslavian vs Immigrants from Latin America In Labor Force | Age 45-54 Correlation Chart
The statistical analysis conducted on geographies consisting of 285,617,404 people shows a poor positive correlation between the proportion of Yugoslavians and labor force participation rate among population between the ages 45 and 54 in the United States with a correlation coefficient (R) of 0.132 and weighted average of 83.0%. Similarly, the statistical analysis conducted on geographies consisting of 557,910,063 people shows a substantial positive correlation between the proportion of Immigrants from Latin America and labor force participation rate among population between the ages 45 and 54 in the United States with a correlation coefficient (R) of 0.581 and weighted average of 81.0%, a difference of 2.4%.
In Labor Force | Age 45-54 Correlation Summary
| Measurement | Yugoslavian | Immigrants from Latin America |
| Minimum | 54.5% | 69.6% |
| Maximum | 100.0% | 100.0% |
| Range | 45.5% | 30.4% |
| Mean | 84.3% | 82.4% |
| Median | 84.4% | 81.8% |
| Interquartile 25% (IQ1) | 82.2% | 80.0% |
| Interquartile 75% (IQ3) | 88.0% | 84.6% |
| Interquartile Range (IQR) | 5.8% | 4.6% |
| Standard Deviation (Sample) | 9.8% | 4.0% |
| Standard Deviation (Population) | 9.7% | 4.0% |
Similar Demographics by In Labor Force | Age 45-54
Demographics Similar to Yugoslavians by In Labor Force | Age 45-54
In terms of in labor force | age 45-54, the demographic groups most similar to Yugoslavians are Scandinavian (83.0%, a difference of 0.0%), Immigrants from Haiti (83.0%, a difference of 0.010%), Immigrants from Scotland (83.0%, a difference of 0.010%), Ghanaian (83.0%, a difference of 0.020%), and Okinawan (83.0%, a difference of 0.020%).
| Demographics | Rating | Rank | In Labor Force | Age 45-54 |
| Liberians | 82.7 /100 | #133 | Excellent 83.0% |
| Sudanese | 82.0 /100 | #134 | Excellent 83.0% |
| Austrians | 81.3 /100 | #135 | Excellent 83.0% |
| Immigrants | Kazakhstan | 81.0 /100 | #136 | Excellent 83.0% |
| Immigrants | Spain | 80.4 /100 | #137 | Excellent 83.0% |
| Ghanaians | 79.5 /100 | #138 | Good 83.0% |
| Scandinavians | 78.5 /100 | #139 | Good 83.0% |
| Yugoslavians | 78.3 /100 | #140 | Good 83.0% |
| Immigrants | Haiti | 77.9 /100 | #141 | Good 83.0% |
| Immigrants | Scotland | 77.8 /100 | #142 | Good 83.0% |
| Okinawans | 77.0 /100 | #143 | Good 83.0% |
| Soviet Union | 76.8 /100 | #144 | Good 83.0% |
| Romanians | 75.4 /100 | #145 | Good 83.0% |
| Immigrants | France | 75.3 /100 | #146 | Good 83.0% |
| Czechoslovakians | 74.8 /100 | #147 | Good 83.0% |
Demographics Similar to Immigrants from Latin America by In Labor Force | Age 45-54
In terms of in labor force | age 45-54, the demographic groups most similar to Immigrants from Latin America are Immigrants from Grenada (81.0%, a difference of 0.0%), Aleut (81.0%, a difference of 0.070%), Immigrants from Guatemala (81.1%, a difference of 0.11%), Immigrants from Micronesia (81.1%, a difference of 0.11%), and Guatemalan (81.2%, a difference of 0.19%).
| Demographics | Rating | Rank | In Labor Force | Age 45-54 |
| Chippewa | 0.0 /100 | #273 | Tragic 81.3% |
| British West Indians | 0.0 /100 | #274 | Tragic 81.2% |
| Immigrants | Nonimmigrants | 0.0 /100 | #275 | Tragic 81.2% |
| U.S. Virgin Islanders | 0.0 /100 | #276 | Tragic 81.2% |
| Guatemalans | 0.0 /100 | #277 | Tragic 81.2% |
| Immigrants | Guatemala | 0.0 /100 | #278 | Tragic 81.1% |
| Immigrants | Micronesia | 0.0 /100 | #279 | Tragic 81.1% |
| Immigrants | Latin America | 0.0 /100 | #280 | Tragic 81.0% |
| Immigrants | Grenada | 0.0 /100 | #281 | Tragic 81.0% |
| Aleuts | 0.0 /100 | #282 | Tragic 81.0% |
| French American Indians | 0.0 /100 | #283 | Tragic 80.8% |
| Belizeans | 0.0 /100 | #284 | Tragic 80.8% |
| Delaware | 0.0 /100 | #285 | Tragic 80.8% |
| Immigrants | Dominica | 0.0 /100 | #286 | Tragic 80.8% |
| Vietnamese | 0.0 /100 | #287 | Tragic 80.8% |