Immigrants from Ghana vs Immigrants from Latin America In Labor Force | Age 45-54
COMPARE
Immigrants from Ghana
Immigrants from Latin America
In Labor Force | Age 45-54
In Labor Force | Age 45-54 Comparison
Immigrants from Ghana
Immigrants from Latin America
82.9%
IN LABOR FORCE | AGE 45-54
70.3/ 100
METRIC RATING
154th/ 347
METRIC RANK
81.0%
IN LABOR FORCE | AGE 45-54
0.0/ 100
METRIC RATING
280th/ 347
METRIC RANK
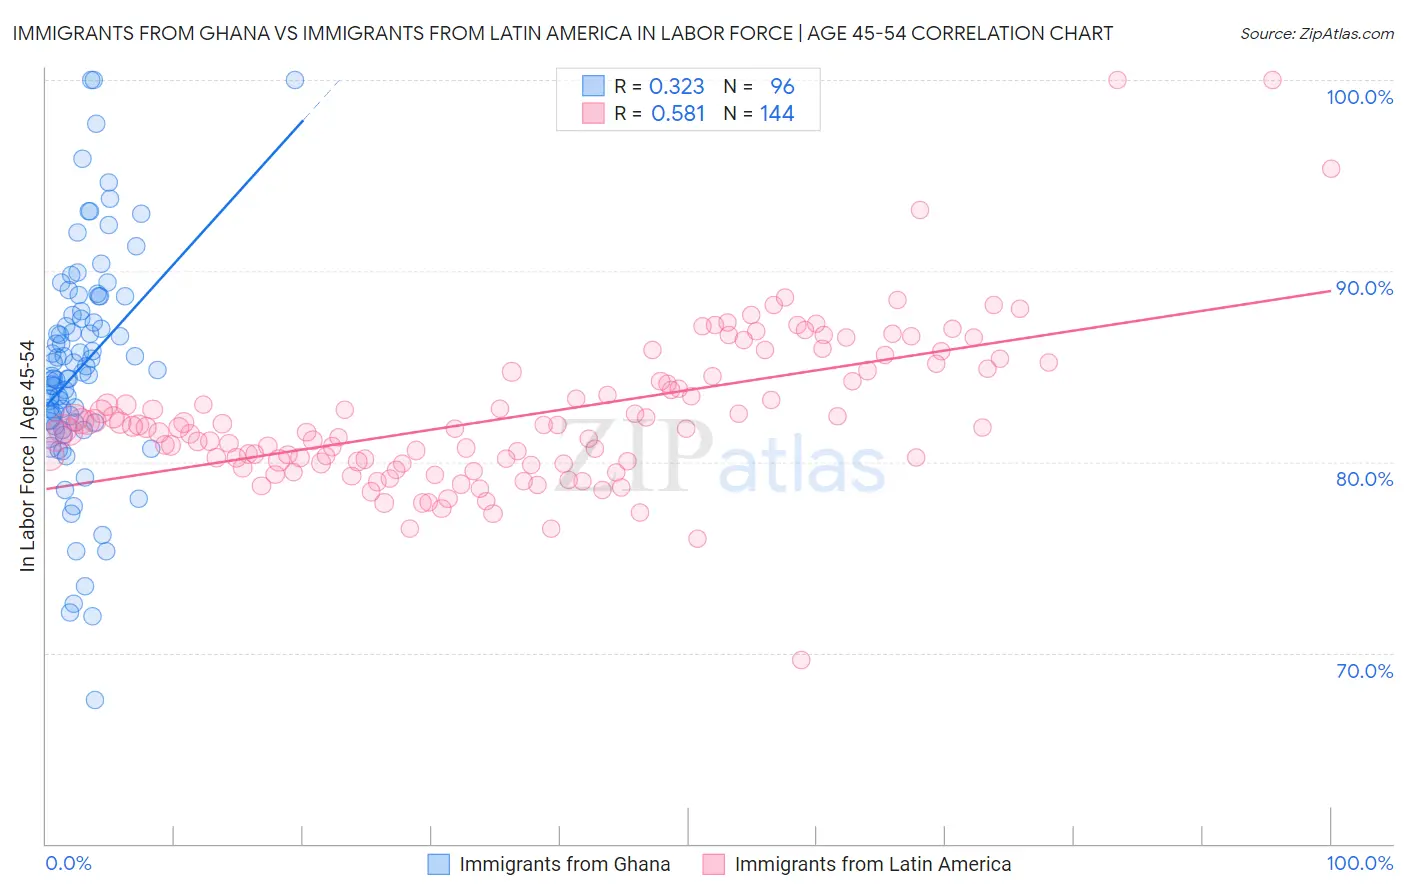
Immigrants from Ghana vs Immigrants from Latin America In Labor Force | Age 45-54 Correlation Chart
The statistical analysis conducted on geographies consisting of 199,808,244 people shows a mild positive correlation between the proportion of Immigrants from Ghana and labor force participation rate among population between the ages 45 and 54 in the United States with a correlation coefficient (R) of 0.323 and weighted average of 82.9%. Similarly, the statistical analysis conducted on geographies consisting of 557,910,063 people shows a substantial positive correlation between the proportion of Immigrants from Latin America and labor force participation rate among population between the ages 45 and 54 in the United States with a correlation coefficient (R) of 0.581 and weighted average of 81.0%, a difference of 2.4%.
In Labor Force | Age 45-54 Correlation Summary
| Measurement | Immigrants from Ghana | Immigrants from Latin America |
| Minimum | 67.5% | 69.6% |
| Maximum | 100.0% | 100.0% |
| Range | 32.5% | 30.4% |
| Mean | 85.0% | 82.4% |
| Median | 84.7% | 81.8% |
| Interquartile 25% (IQ1) | 82.1% | 80.0% |
| Interquartile 75% (IQ3) | 88.3% | 84.6% |
| Interquartile Range (IQR) | 6.2% | 4.6% |
| Standard Deviation (Sample) | 6.0% | 4.0% |
| Standard Deviation (Population) | 5.9% | 4.0% |
Similar Demographics by In Labor Force | Age 45-54
Demographics Similar to Immigrants from Ghana by In Labor Force | Age 45-54
In terms of in labor force | age 45-54, the demographic groups most similar to Immigrants from Ghana are Immigrants from Indonesia (82.9%, a difference of 0.0%), Slavic (82.9%, a difference of 0.010%), Immigrants from Philippines (82.9%, a difference of 0.010%), Immigrants from Netherlands (82.9%, a difference of 0.020%), and Korean (82.9%, a difference of 0.020%).
| Demographics | Rating | Rank | In Labor Force | Age 45-54 |
| Czechoslovakians | 74.8 /100 | #147 | Good 83.0% |
| Immigrants | Nigeria | 74.1 /100 | #148 | Good 83.0% |
| Immigrants | Sweden | 73.3 /100 | #149 | Good 82.9% |
| Immigrants | Netherlands | 72.6 /100 | #150 | Good 82.9% |
| Koreans | 71.9 /100 | #151 | Good 82.9% |
| Slavs | 71.5 /100 | #152 | Good 82.9% |
| Immigrants | Indonesia | 70.6 /100 | #153 | Good 82.9% |
| Immigrants | Ghana | 70.3 /100 | #154 | Good 82.9% |
| Immigrants | Philippines | 69.0 /100 | #155 | Good 82.9% |
| Immigrants | Saudi Arabia | 68.8 /100 | #156 | Good 82.9% |
| Immigrants | Australia | 68.2 /100 | #157 | Good 82.9% |
| Immigrants | Southern Europe | 67.8 /100 | #158 | Good 82.9% |
| Immigrants | Austria | 64.6 /100 | #159 | Good 82.9% |
| Laotians | 62.8 /100 | #160 | Good 82.9% |
| South American Indians | 62.2 /100 | #161 | Good 82.9% |
Demographics Similar to Immigrants from Latin America by In Labor Force | Age 45-54
In terms of in labor force | age 45-54, the demographic groups most similar to Immigrants from Latin America are Immigrants from Grenada (81.0%, a difference of 0.0%), Aleut (81.0%, a difference of 0.070%), Immigrants from Guatemala (81.1%, a difference of 0.11%), Immigrants from Micronesia (81.1%, a difference of 0.11%), and Guatemalan (81.2%, a difference of 0.19%).
| Demographics | Rating | Rank | In Labor Force | Age 45-54 |
| Chippewa | 0.0 /100 | #273 | Tragic 81.3% |
| British West Indians | 0.0 /100 | #274 | Tragic 81.2% |
| Immigrants | Nonimmigrants | 0.0 /100 | #275 | Tragic 81.2% |
| U.S. Virgin Islanders | 0.0 /100 | #276 | Tragic 81.2% |
| Guatemalans | 0.0 /100 | #277 | Tragic 81.2% |
| Immigrants | Guatemala | 0.0 /100 | #278 | Tragic 81.1% |
| Immigrants | Micronesia | 0.0 /100 | #279 | Tragic 81.1% |
| Immigrants | Latin America | 0.0 /100 | #280 | Tragic 81.0% |
| Immigrants | Grenada | 0.0 /100 | #281 | Tragic 81.0% |
| Aleuts | 0.0 /100 | #282 | Tragic 81.0% |
| French American Indians | 0.0 /100 | #283 | Tragic 80.8% |
| Belizeans | 0.0 /100 | #284 | Tragic 80.8% |
| Delaware | 0.0 /100 | #285 | Tragic 80.8% |
| Immigrants | Dominica | 0.0 /100 | #286 | Tragic 80.8% |
| Vietnamese | 0.0 /100 | #287 | Tragic 80.8% |