Yugoslavian vs Mexican American Indian In Labor Force | Age 45-54
COMPARE
Yugoslavian
Mexican American Indian
In Labor Force | Age 45-54
In Labor Force | Age 45-54 Comparison
Yugoslavians
Mexican American Indians
83.0%
IN LABOR FORCE | AGE 45-54
78.3/ 100
METRIC RATING
140th/ 347
METRIC RANK
80.7%
IN LABOR FORCE | AGE 45-54
0.0/ 100
METRIC RATING
290th/ 347
METRIC RANK
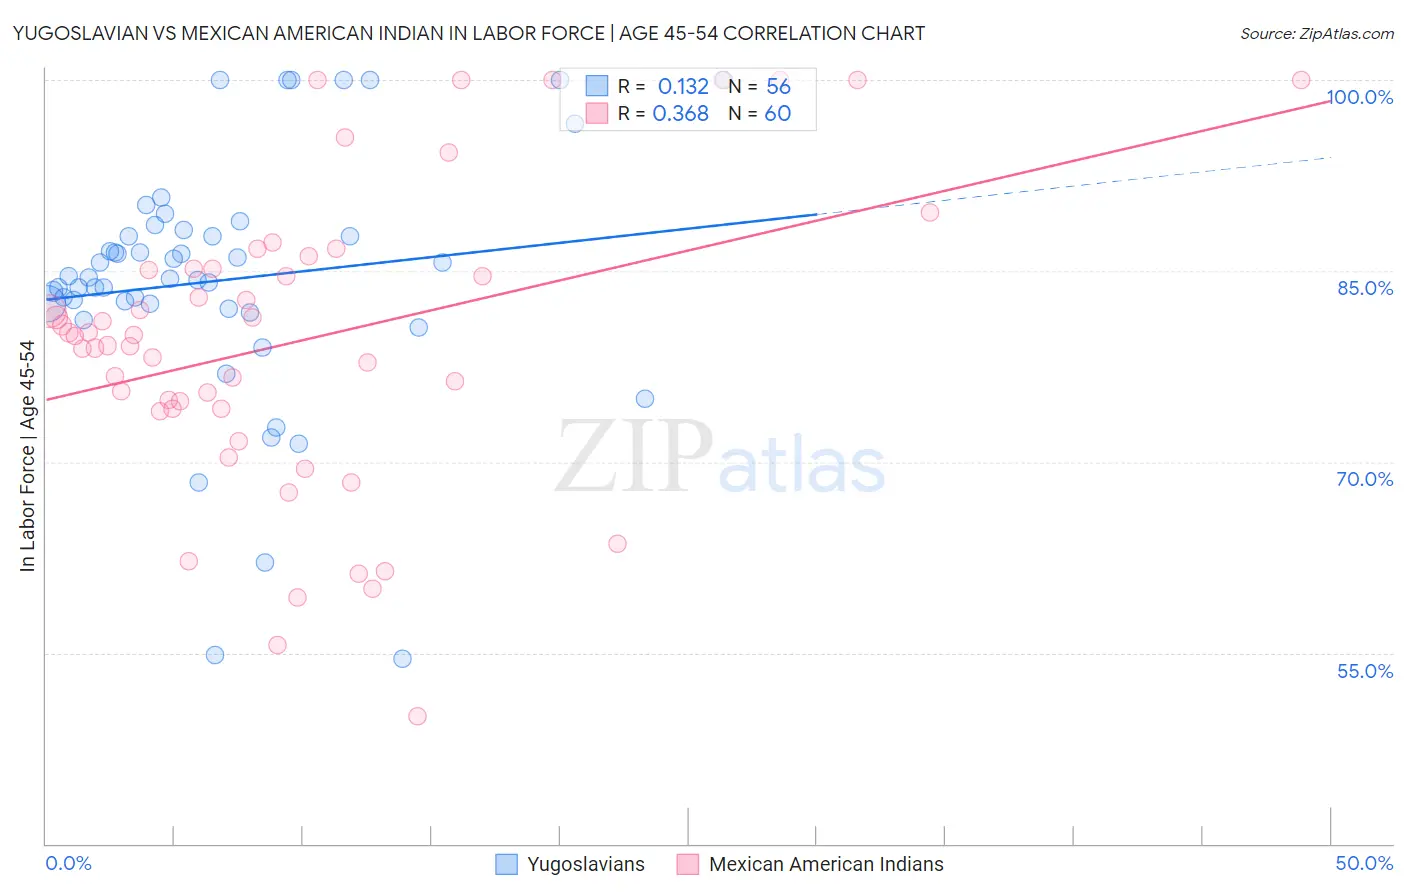
Yugoslavian vs Mexican American Indian In Labor Force | Age 45-54 Correlation Chart
The statistical analysis conducted on geographies consisting of 285,617,404 people shows a poor positive correlation between the proportion of Yugoslavians and labor force participation rate among population between the ages 45 and 54 in the United States with a correlation coefficient (R) of 0.132 and weighted average of 83.0%. Similarly, the statistical analysis conducted on geographies consisting of 317,497,854 people shows a mild positive correlation between the proportion of Mexican American Indians and labor force participation rate among population between the ages 45 and 54 in the United States with a correlation coefficient (R) of 0.368 and weighted average of 80.7%, a difference of 2.8%.
In Labor Force | Age 45-54 Correlation Summary
| Measurement | Yugoslavian | Mexican American Indian |
| Minimum | 54.5% | 50.0% |
| Maximum | 100.0% | 100.0% |
| Range | 45.5% | 50.0% |
| Mean | 84.3% | 79.5% |
| Median | 84.4% | 80.0% |
| Interquartile 25% (IQ1) | 82.2% | 74.2% |
| Interquartile 75% (IQ3) | 88.0% | 85.1% |
| Interquartile Range (IQR) | 5.8% | 11.0% |
| Standard Deviation (Sample) | 9.8% | 11.7% |
| Standard Deviation (Population) | 9.7% | 11.6% |
Similar Demographics by In Labor Force | Age 45-54
Demographics Similar to Yugoslavians by In Labor Force | Age 45-54
In terms of in labor force | age 45-54, the demographic groups most similar to Yugoslavians are Scandinavian (83.0%, a difference of 0.0%), Immigrants from Haiti (83.0%, a difference of 0.010%), Immigrants from Scotland (83.0%, a difference of 0.010%), Ghanaian (83.0%, a difference of 0.020%), and Okinawan (83.0%, a difference of 0.020%).
| Demographics | Rating | Rank | In Labor Force | Age 45-54 |
| Liberians | 82.7 /100 | #133 | Excellent 83.0% |
| Sudanese | 82.0 /100 | #134 | Excellent 83.0% |
| Austrians | 81.3 /100 | #135 | Excellent 83.0% |
| Immigrants | Kazakhstan | 81.0 /100 | #136 | Excellent 83.0% |
| Immigrants | Spain | 80.4 /100 | #137 | Excellent 83.0% |
| Ghanaians | 79.5 /100 | #138 | Good 83.0% |
| Scandinavians | 78.5 /100 | #139 | Good 83.0% |
| Yugoslavians | 78.3 /100 | #140 | Good 83.0% |
| Immigrants | Haiti | 77.9 /100 | #141 | Good 83.0% |
| Immigrants | Scotland | 77.8 /100 | #142 | Good 83.0% |
| Okinawans | 77.0 /100 | #143 | Good 83.0% |
| Soviet Union | 76.8 /100 | #144 | Good 83.0% |
| Romanians | 75.4 /100 | #145 | Good 83.0% |
| Immigrants | France | 75.3 /100 | #146 | Good 83.0% |
| Czechoslovakians | 74.8 /100 | #147 | Good 83.0% |
Demographics Similar to Mexican American Indians by In Labor Force | Age 45-54
In terms of in labor force | age 45-54, the demographic groups most similar to Mexican American Indians are Immigrants from Bangladesh (80.7%, a difference of 0.030%), Cree (80.8%, a difference of 0.060%), Delaware (80.8%, a difference of 0.070%), Immigrants from Dominica (80.8%, a difference of 0.070%), and Vietnamese (80.8%, a difference of 0.070%).
| Demographics | Rating | Rank | In Labor Force | Age 45-54 |
| French American Indians | 0.0 /100 | #283 | Tragic 80.8% |
| Belizeans | 0.0 /100 | #284 | Tragic 80.8% |
| Delaware | 0.0 /100 | #285 | Tragic 80.8% |
| Immigrants | Dominica | 0.0 /100 | #286 | Tragic 80.8% |
| Vietnamese | 0.0 /100 | #287 | Tragic 80.8% |
| Cree | 0.0 /100 | #288 | Tragic 80.8% |
| Immigrants | Bangladesh | 0.0 /100 | #289 | Tragic 80.7% |
| Mexican American Indians | 0.0 /100 | #290 | Tragic 80.7% |
| Immigrants | Belize | 0.0 /100 | #291 | Tragic 80.6% |
| Iroquois | 0.0 /100 | #292 | Tragic 80.6% |
| Osage | 0.0 /100 | #293 | Tragic 80.6% |
| Yakama | 0.0 /100 | #294 | Tragic 80.6% |
| Nepalese | 0.0 /100 | #295 | Tragic 80.5% |
| Africans | 0.0 /100 | #296 | Tragic 80.5% |
| Americans | 0.0 /100 | #297 | Tragic 80.4% |