Bahamian vs Guyanese In Labor Force | Age 25-29
COMPARE
Bahamian
Guyanese
In Labor Force | Age 25-29
In Labor Force | Age 25-29 Comparison
Bahamians
Guyanese
83.7%
IN LABOR FORCE | AGE 25-29
0.2/ 100
METRIC RATING
251st/ 347
METRIC RANK
83.0%
IN LABOR FORCE | AGE 25-29
0.0/ 100
METRIC RATING
287th/ 347
METRIC RANK
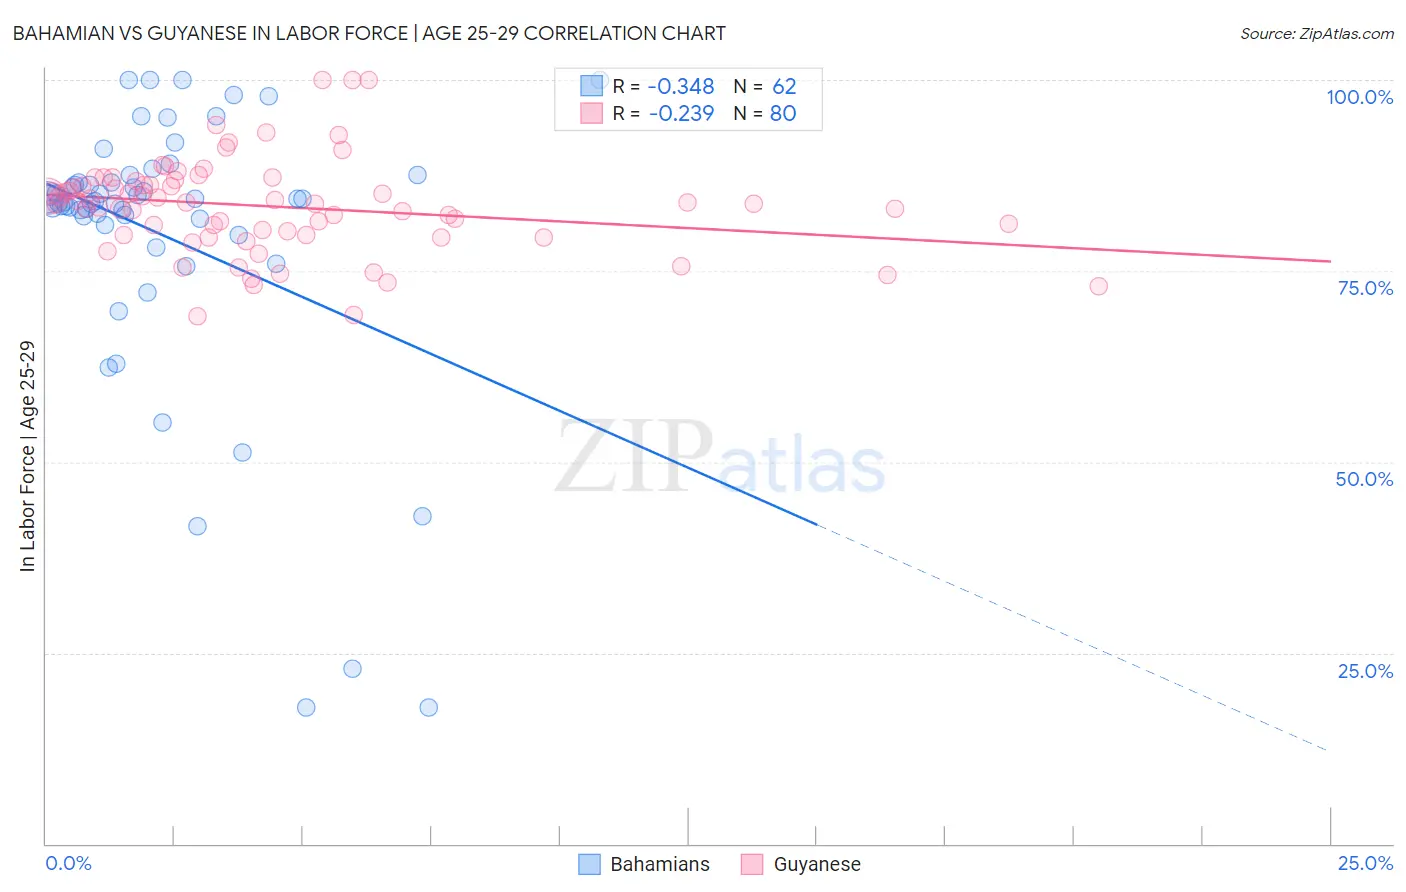
Bahamian vs Guyanese In Labor Force | Age 25-29 Correlation Chart
The statistical analysis conducted on geographies consisting of 112,690,388 people shows a mild negative correlation between the proportion of Bahamians and labor force participation rate among population between the ages 25 and 29 in the United States with a correlation coefficient (R) of -0.348 and weighted average of 83.7%. Similarly, the statistical analysis conducted on geographies consisting of 176,912,088 people shows a weak negative correlation between the proportion of Guyanese and labor force participation rate among population between the ages 25 and 29 in the United States with a correlation coefficient (R) of -0.239 and weighted average of 83.0%, a difference of 0.79%.
In Labor Force | Age 25-29 Correlation Summary
| Measurement | Bahamian | Guyanese |
| Minimum | 17.9% | 69.1% |
| Maximum | 100.0% | 100.0% |
| Range | 82.1% | 30.9% |
| Mean | 79.6% | 83.4% |
| Median | 84.1% | 84.0% |
| Interquartile 25% (IQ1) | 81.1% | 79.7% |
| Interquartile 75% (IQ3) | 86.5% | 86.5% |
| Interquartile Range (IQR) | 5.5% | 6.8% |
| Standard Deviation (Sample) | 18.2% | 6.2% |
| Standard Deviation (Population) | 18.0% | 6.2% |
Similar Demographics by In Labor Force | Age 25-29
Demographics Similar to Bahamians by In Labor Force | Age 25-29
In terms of in labor force | age 25-29, the demographic groups most similar to Bahamians are Guatemalan (83.7%, a difference of 0.010%), Immigrants from Trinidad and Tobago (83.7%, a difference of 0.010%), Spaniard (83.7%, a difference of 0.010%), Central American (83.7%, a difference of 0.020%), and Hmong (83.7%, a difference of 0.030%).
| Demographics | Rating | Rank | In Labor Force | Age 25-29 |
| Immigrants | Jamaica | 0.4 /100 | #244 | Tragic 83.8% |
| Iroquois | 0.4 /100 | #245 | Tragic 83.8% |
| Cree | 0.3 /100 | #246 | Tragic 83.8% |
| Immigrants | El Salvador | 0.3 /100 | #247 | Tragic 83.7% |
| Immigrants | Nonimmigrants | 0.3 /100 | #248 | Tragic 83.7% |
| Hmong | 0.3 /100 | #249 | Tragic 83.7% |
| Central Americans | 0.2 /100 | #250 | Tragic 83.7% |
| Bahamians | 0.2 /100 | #251 | Tragic 83.7% |
| Guatemalans | 0.2 /100 | #252 | Tragic 83.7% |
| Immigrants | Trinidad and Tobago | 0.2 /100 | #253 | Tragic 83.7% |
| Spaniards | 0.2 /100 | #254 | Tragic 83.7% |
| Haitians | 0.2 /100 | #255 | Tragic 83.7% |
| Immigrants | Haiti | 0.2 /100 | #256 | Tragic 83.7% |
| Delaware | 0.2 /100 | #257 | Tragic 83.7% |
| Immigrants | Guatemala | 0.1 /100 | #258 | Tragic 83.6% |
Demographics Similar to Guyanese by In Labor Force | Age 25-29
In terms of in labor force | age 25-29, the demographic groups most similar to Guyanese are Mexican American Indian (83.0%, a difference of 0.020%), Belizean (83.1%, a difference of 0.030%), Ottawa (83.0%, a difference of 0.030%), Immigrants from Micronesia (83.0%, a difference of 0.050%), and Nicaraguan (83.1%, a difference of 0.070%).
| Demographics | Rating | Rank | In Labor Force | Age 25-29 |
| Dominicans | 0.0 /100 | #280 | Tragic 83.2% |
| Immigrants | Dominican Republic | 0.0 /100 | #281 | Tragic 83.1% |
| Americans | 0.0 /100 | #282 | Tragic 83.1% |
| Immigrants | Azores | 0.0 /100 | #283 | Tragic 83.1% |
| Nicaraguans | 0.0 /100 | #284 | Tragic 83.1% |
| Belizeans | 0.0 /100 | #285 | Tragic 83.1% |
| Mexican American Indians | 0.0 /100 | #286 | Tragic 83.0% |
| Guyanese | 0.0 /100 | #287 | Tragic 83.0% |
| Ottawa | 0.0 /100 | #288 | Tragic 83.0% |
| Immigrants | Micronesia | 0.0 /100 | #289 | Tragic 83.0% |
| Immigrants | Bangladesh | 0.0 /100 | #290 | Tragic 83.0% |
| Hawaiians | 0.0 /100 | #291 | Tragic 83.0% |
| Immigrants | Guyana | 0.0 /100 | #292 | Tragic 83.0% |
| Immigrants | Latin America | 0.0 /100 | #293 | Tragic 82.9% |
| Nepalese | 0.0 /100 | #294 | Tragic 82.9% |