Yugoslavian vs Immigrants from Ethiopia In Labor Force | Age 25-29
COMPARE
Yugoslavian
Immigrants from Ethiopia
In Labor Force | Age 25-29
In Labor Force | Age 25-29 Comparison
Yugoslavians
Immigrants from Ethiopia
85.6%
IN LABOR FORCE | AGE 25-29
99.8/ 100
METRIC RATING
50th/ 347
METRIC RANK
86.1%
IN LABOR FORCE | AGE 25-29
100.0/ 100
METRIC RATING
11th/ 347
METRIC RANK
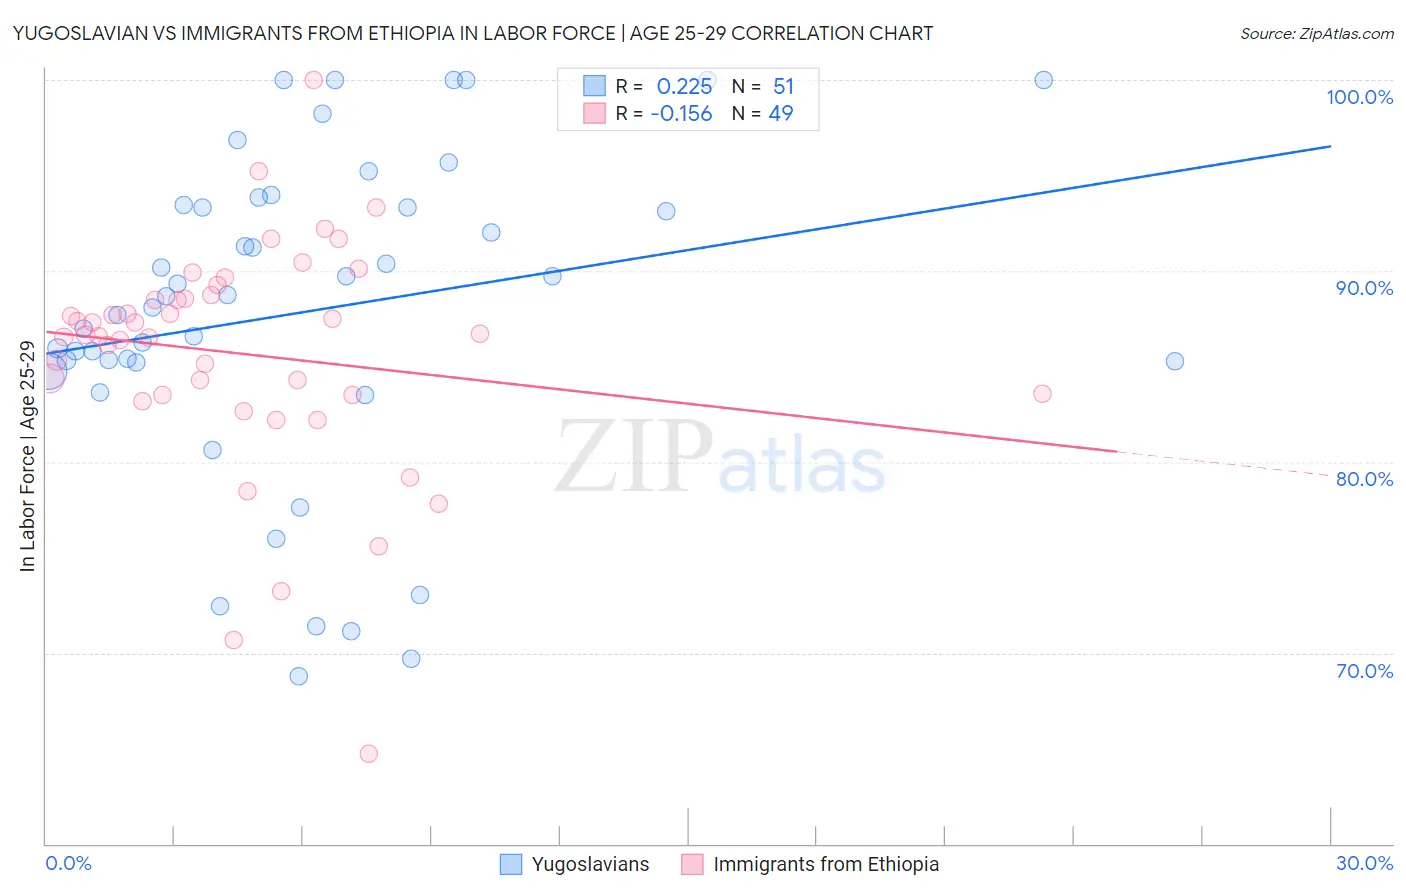
Yugoslavian vs Immigrants from Ethiopia In Labor Force | Age 25-29 Correlation Chart
The statistical analysis conducted on geographies consisting of 285,642,405 people shows a weak positive correlation between the proportion of Yugoslavians and labor force participation rate among population between the ages 25 and 29 in the United States with a correlation coefficient (R) of 0.225 and weighted average of 85.6%. Similarly, the statistical analysis conducted on geographies consisting of 211,531,524 people shows a poor negative correlation between the proportion of Immigrants from Ethiopia and labor force participation rate among population between the ages 25 and 29 in the United States with a correlation coefficient (R) of -0.156 and weighted average of 86.1%, a difference of 0.63%.
In Labor Force | Age 25-29 Correlation Summary
| Measurement | Yugoslavian | Immigrants from Ethiopia |
| Minimum | 68.8% | 64.7% |
| Maximum | 100.0% | 100.0% |
| Range | 31.2% | 35.3% |
| Mean | 87.9% | 85.7% |
| Median | 88.7% | 86.6% |
| Interquartile 25% (IQ1) | 85.2% | 83.5% |
| Interquartile 75% (IQ3) | 93.5% | 88.6% |
| Interquartile Range (IQR) | 8.3% | 5.2% |
| Standard Deviation (Sample) | 8.4% | 6.1% |
| Standard Deviation (Population) | 8.3% | 6.0% |
Similar Demographics by In Labor Force | Age 25-29
Demographics Similar to Yugoslavians by In Labor Force | Age 25-29
In terms of in labor force | age 25-29, the demographic groups most similar to Yugoslavians are Immigrants from Latvia (85.6%, a difference of 0.0%), Swedish (85.6%, a difference of 0.030%), Immigrants from Poland (85.6%, a difference of 0.030%), Turkish (85.6%, a difference of 0.040%), and Italian (85.6%, a difference of 0.040%).
| Demographics | Rating | Rank | In Labor Force | Age 25-29 |
| Immigrants | India | 99.9 /100 | #43 | Exceptional 85.7% |
| Macedonians | 99.9 /100 | #44 | Exceptional 85.7% |
| Immigrants | Sierra Leone | 99.9 /100 | #45 | Exceptional 85.7% |
| Czechs | 99.8 /100 | #46 | Exceptional 85.6% |
| Turks | 99.8 /100 | #47 | Exceptional 85.6% |
| Italians | 99.8 /100 | #48 | Exceptional 85.6% |
| Swedes | 99.8 /100 | #49 | Exceptional 85.6% |
| Yugoslavians | 99.8 /100 | #50 | Exceptional 85.6% |
| Immigrants | Latvia | 99.8 /100 | #51 | Exceptional 85.6% |
| Immigrants | Poland | 99.7 /100 | #52 | Exceptional 85.6% |
| Belgians | 99.7 /100 | #53 | Exceptional 85.5% |
| Albanians | 99.7 /100 | #54 | Exceptional 85.5% |
| Immigrants | Brazil | 99.7 /100 | #55 | Exceptional 85.5% |
| Eastern Europeans | 99.6 /100 | #56 | Exceptional 85.5% |
| Estonians | 99.6 /100 | #57 | Exceptional 85.5% |
Demographics Similar to Immigrants from Ethiopia by In Labor Force | Age 25-29
In terms of in labor force | age 25-29, the demographic groups most similar to Immigrants from Ethiopia are Liberian (86.1%, a difference of 0.0%), Immigrants from Lithuania (86.1%, a difference of 0.010%), Norwegian (86.1%, a difference of 0.020%), Ethiopian (86.2%, a difference of 0.050%), and Latvian (86.1%, a difference of 0.050%).
| Demographics | Rating | Rank | In Labor Force | Age 25-29 |
| Carpatho Rusyns | 100.0 /100 | #4 | Exceptional 87.0% |
| Luxembourgers | 100.0 /100 | #5 | Exceptional 86.9% |
| Slovenes | 100.0 /100 | #6 | Exceptional 86.4% |
| Immigrants | Bosnia and Herzegovina | 100.0 /100 | #7 | Exceptional 86.3% |
| Immigrants | Cabo Verde | 100.0 /100 | #8 | Exceptional 86.2% |
| Ethiopians | 100.0 /100 | #9 | Exceptional 86.2% |
| Liberians | 100.0 /100 | #10 | Exceptional 86.1% |
| Immigrants | Ethiopia | 100.0 /100 | #11 | Exceptional 86.1% |
| Immigrants | Lithuania | 100.0 /100 | #12 | Exceptional 86.1% |
| Norwegians | 100.0 /100 | #13 | Exceptional 86.1% |
| Latvians | 100.0 /100 | #14 | Exceptional 86.1% |
| Bolivians | 100.0 /100 | #15 | Exceptional 86.1% |
| Immigrants | Bolivia | 100.0 /100 | #16 | Exceptional 86.1% |
| Bermudans | 100.0 /100 | #17 | Exceptional 86.0% |
| Bulgarians | 100.0 /100 | #18 | Exceptional 86.0% |