Yugoslavian vs Soviet Union In Labor Force | Age 25-29
COMPARE
Yugoslavian
Soviet Union
In Labor Force | Age 25-29
In Labor Force | Age 25-29 Comparison
Yugoslavians
Soviet Union
85.6%
IN LABOR FORCE | AGE 25-29
99.8/ 100
METRIC RATING
50th/ 347
METRIC RANK
85.3%
IN LABOR FORCE | AGE 25-29
98.5/ 100
METRIC RATING
74th/ 347
METRIC RANK
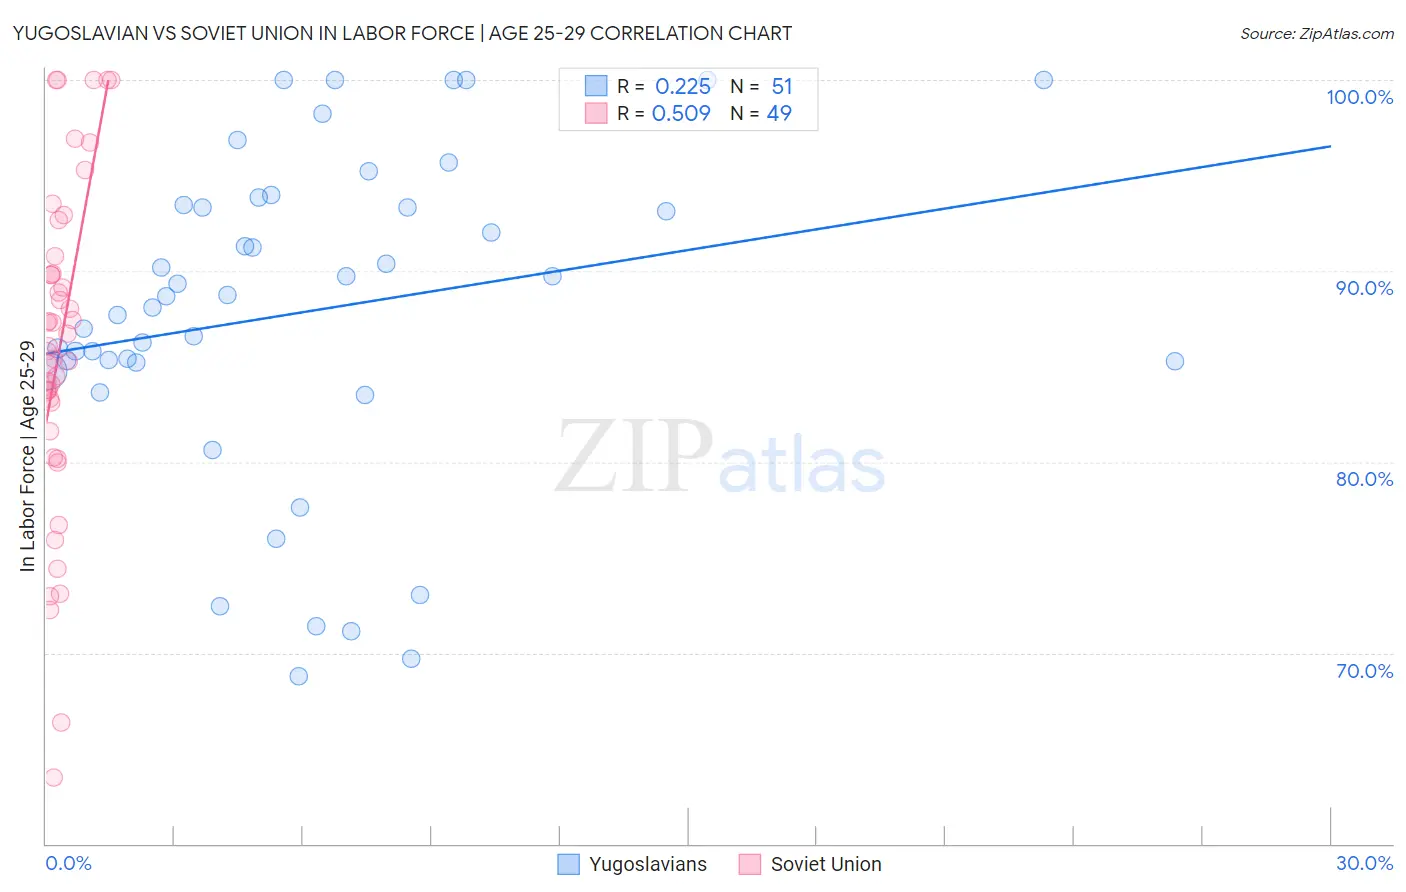
Yugoslavian vs Soviet Union In Labor Force | Age 25-29 Correlation Chart
The statistical analysis conducted on geographies consisting of 285,642,405 people shows a weak positive correlation between the proportion of Yugoslavians and labor force participation rate among population between the ages 25 and 29 in the United States with a correlation coefficient (R) of 0.225 and weighted average of 85.6%. Similarly, the statistical analysis conducted on geographies consisting of 43,504,224 people shows a substantial positive correlation between the proportion of Soviet Union and labor force participation rate among population between the ages 25 and 29 in the United States with a correlation coefficient (R) of 0.509 and weighted average of 85.3%, a difference of 0.33%.
In Labor Force | Age 25-29 Correlation Summary
| Measurement | Yugoslavian | Soviet Union |
| Minimum | 68.8% | 63.5% |
| Maximum | 100.0% | 100.0% |
| Range | 31.2% | 36.5% |
| Mean | 87.9% | 86.0% |
| Median | 88.7% | 86.1% |
| Interquartile 25% (IQ1) | 85.2% | 82.3% |
| Interquartile 75% (IQ3) | 93.5% | 90.3% |
| Interquartile Range (IQR) | 8.3% | 8.0% |
| Standard Deviation (Sample) | 8.4% | 8.5% |
| Standard Deviation (Population) | 8.3% | 8.4% |
Similar Demographics by In Labor Force | Age 25-29
Demographics Similar to Yugoslavians by In Labor Force | Age 25-29
In terms of in labor force | age 25-29, the demographic groups most similar to Yugoslavians are Immigrants from Latvia (85.6%, a difference of 0.0%), Swedish (85.6%, a difference of 0.030%), Immigrants from Poland (85.6%, a difference of 0.030%), Turkish (85.6%, a difference of 0.040%), and Italian (85.6%, a difference of 0.040%).
| Demographics | Rating | Rank | In Labor Force | Age 25-29 |
| Immigrants | India | 99.9 /100 | #43 | Exceptional 85.7% |
| Macedonians | 99.9 /100 | #44 | Exceptional 85.7% |
| Immigrants | Sierra Leone | 99.9 /100 | #45 | Exceptional 85.7% |
| Czechs | 99.8 /100 | #46 | Exceptional 85.6% |
| Turks | 99.8 /100 | #47 | Exceptional 85.6% |
| Italians | 99.8 /100 | #48 | Exceptional 85.6% |
| Swedes | 99.8 /100 | #49 | Exceptional 85.6% |
| Yugoslavians | 99.8 /100 | #50 | Exceptional 85.6% |
| Immigrants | Latvia | 99.8 /100 | #51 | Exceptional 85.6% |
| Immigrants | Poland | 99.7 /100 | #52 | Exceptional 85.6% |
| Belgians | 99.7 /100 | #53 | Exceptional 85.5% |
| Albanians | 99.7 /100 | #54 | Exceptional 85.5% |
| Immigrants | Brazil | 99.7 /100 | #55 | Exceptional 85.5% |
| Eastern Europeans | 99.6 /100 | #56 | Exceptional 85.5% |
| Estonians | 99.6 /100 | #57 | Exceptional 85.5% |
Demographics Similar to Soviet Union by In Labor Force | Age 25-29
In terms of in labor force | age 25-29, the demographic groups most similar to Soviet Union are Brazilian (85.3%, a difference of 0.030%), Russian (85.3%, a difference of 0.040%), Immigrants from Australia (85.3%, a difference of 0.050%), German (85.3%, a difference of 0.050%), and Kenyan (85.4%, a difference of 0.070%).
| Demographics | Rating | Rank | In Labor Force | Age 25-29 |
| Immigrants | Turkey | 99.2 /100 | #67 | Exceptional 85.4% |
| Immigrants | Cameroon | 99.2 /100 | #68 | Exceptional 85.4% |
| Menominee | 99.1 /100 | #69 | Exceptional 85.4% |
| Immigrants | Sweden | 99.1 /100 | #70 | Exceptional 85.4% |
| Kenyans | 99.0 /100 | #71 | Exceptional 85.4% |
| Immigrants | Australia | 98.9 /100 | #72 | Exceptional 85.3% |
| Russians | 98.8 /100 | #73 | Exceptional 85.3% |
| Soviet Union | 98.5 /100 | #74 | Exceptional 85.3% |
| Brazilians | 98.3 /100 | #75 | Exceptional 85.3% |
| Germans | 98.1 /100 | #76 | Exceptional 85.3% |
| Immigrants | South Central Asia | 97.9 /100 | #77 | Exceptional 85.2% |
| Immigrants | Egypt | 97.7 /100 | #78 | Exceptional 85.2% |
| Immigrants | Northern Africa | 97.6 /100 | #79 | Exceptional 85.2% |
| Immigrants | Zimbabwe | 97.6 /100 | #80 | Exceptional 85.2% |
| Immigrants | Northern Europe | 97.2 /100 | #81 | Exceptional 85.2% |