Immigrants from Cuba vs Russian In Labor Force | Age 16-19
COMPARE
Immigrants from Cuba
Russian
In Labor Force | Age 16-19
In Labor Force | Age 16-19 Comparison
Immigrants from Cuba
Russians
30.2%
IN LABOR FORCE | AGE 16-19
0.0/ 100
METRIC RATING
335th/ 347
METRIC RANK
36.7%
IN LABOR FORCE | AGE 16-19
57.5/ 100
METRIC RATING
173rd/ 347
METRIC RANK
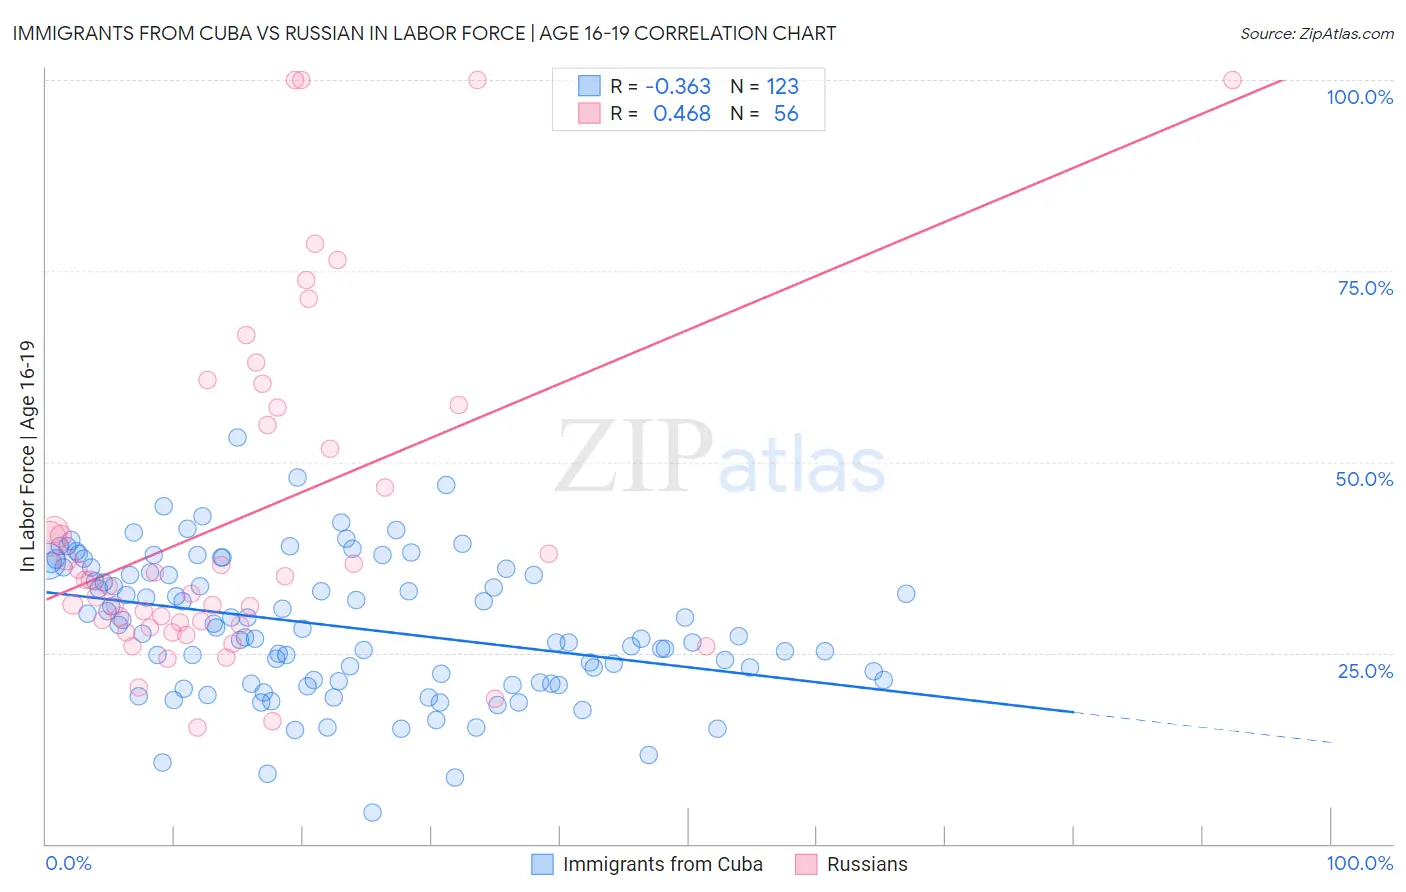
Immigrants from Cuba vs Russian In Labor Force | Age 16-19 Correlation Chart
The statistical analysis conducted on geographies consisting of 325,558,601 people shows a mild negative correlation between the proportion of Immigrants from Cuba and labor force participation rate among population between the ages 16 and 19 in the United States with a correlation coefficient (R) of -0.363 and weighted average of 30.2%. Similarly, the statistical analysis conducted on geographies consisting of 510,287,384 people shows a moderate positive correlation between the proportion of Russians and labor force participation rate among population between the ages 16 and 19 in the United States with a correlation coefficient (R) of 0.468 and weighted average of 36.7%, a difference of 21.4%.
In Labor Force | Age 16-19 Correlation Summary
| Measurement | Immigrants from Cuba | Russian |
| Minimum | 4.1% | 15.3% |
| Maximum | 53.2% | 100.0% |
| Range | 49.1% | 84.7% |
| Mean | 28.4% | 42.9% |
| Median | 28.1% | 34.6% |
| Interquartile 25% (IQ1) | 21.2% | 28.8% |
| Interquartile 75% (IQ3) | 36.0% | 56.0% |
| Interquartile Range (IQR) | 14.8% | 27.2% |
| Standard Deviation (Sample) | 9.1% | 22.2% |
| Standard Deviation (Population) | 9.0% | 22.0% |
Similar Demographics by In Labor Force | Age 16-19
Demographics Similar to Immigrants from Cuba by In Labor Force | Age 16-19
In terms of in labor force | age 16-19, the demographic groups most similar to Immigrants from Cuba are Immigrants from Trinidad and Tobago (30.2%, a difference of 0.29%), Puerto Rican (30.3%, a difference of 0.33%), Immigrants from Bangladesh (30.0%, a difference of 0.66%), Immigrants from Hong Kong (30.5%, a difference of 0.75%), and Immigrants from Israel (30.5%, a difference of 0.77%).
| Demographics | Rating | Rank | In Labor Force | Age 16-19 |
| Immigrants | Ecuador | 0.0 /100 | #328 | Tragic 31.0% |
| Barbadians | 0.0 /100 | #329 | Tragic 31.0% |
| Lumbee | 0.0 /100 | #330 | Tragic 31.0% |
| Trinidadians and Tobagonians | 0.0 /100 | #331 | Tragic 30.9% |
| Immigrants | Israel | 0.0 /100 | #332 | Tragic 30.5% |
| Immigrants | Hong Kong | 0.0 /100 | #333 | Tragic 30.5% |
| Puerto Ricans | 0.0 /100 | #334 | Tragic 30.3% |
| Immigrants | Cuba | 0.0 /100 | #335 | Tragic 30.2% |
| Immigrants | Trinidad and Tobago | 0.0 /100 | #336 | Tragic 30.2% |
| Immigrants | Bangladesh | 0.0 /100 | #337 | Tragic 30.0% |
| Vietnamese | 0.0 /100 | #338 | Tragic 29.6% |
| Immigrants | Uzbekistan | 0.0 /100 | #339 | Tragic 29.2% |
| British West Indians | 0.0 /100 | #340 | Tragic 29.1% |
| Immigrants | Armenia | 0.0 /100 | #341 | Tragic 29.0% |
| Immigrants | Barbados | 0.0 /100 | #342 | Tragic 29.0% |
Demographics Similar to Russians by In Labor Force | Age 16-19
In terms of in labor force | age 16-19, the demographic groups most similar to Russians are Immigrants from Cambodia (36.7%, a difference of 0.040%), South African (36.7%, a difference of 0.040%), Immigrants from South Africa (36.8%, a difference of 0.15%), Immigrants from Latvia (36.8%, a difference of 0.21%), and Palestinian (36.8%, a difference of 0.29%).
| Demographics | Rating | Rank | In Labor Force | Age 16-19 |
| Immigrants | Western Africa | 66.7 /100 | #166 | Good 36.9% |
| Arabs | 63.6 /100 | #167 | Good 36.8% |
| Palestinians | 63.1 /100 | #168 | Good 36.8% |
| Immigrants | Latvia | 61.6 /100 | #169 | Good 36.8% |
| Immigrants | South Africa | 60.5 /100 | #170 | Good 36.8% |
| Immigrants | Cambodia | 58.4 /100 | #171 | Average 36.7% |
| South Africans | 58.3 /100 | #172 | Average 36.7% |
| Russians | 57.5 /100 | #173 | Average 36.7% |
| Immigrants | Czechoslovakia | 50.0 /100 | #174 | Average 36.6% |
| Natives/Alaskans | 49.0 /100 | #175 | Average 36.6% |
| Albanians | 48.8 /100 | #176 | Average 36.5% |
| Immigrants | Northern Europe | 46.6 /100 | #177 | Average 36.5% |
| Blacks/African Americans | 45.1 /100 | #178 | Average 36.5% |
| Immigrants | Southern Europe | 43.3 /100 | #179 | Average 36.4% |
| Immigrants | Morocco | 41.1 /100 | #180 | Average 36.4% |