Immigrants from Sierra Leone vs Russian In Labor Force | Age 16-19
COMPARE
Immigrants from Sierra Leone
Russian
In Labor Force | Age 16-19
In Labor Force | Age 16-19 Comparison
Immigrants from Sierra Leone
Russians
37.3%
IN LABOR FORCE | AGE 16-19
83.6/ 100
METRIC RATING
152nd/ 347
METRIC RANK
36.7%
IN LABOR FORCE | AGE 16-19
57.5/ 100
METRIC RATING
173rd/ 347
METRIC RANK
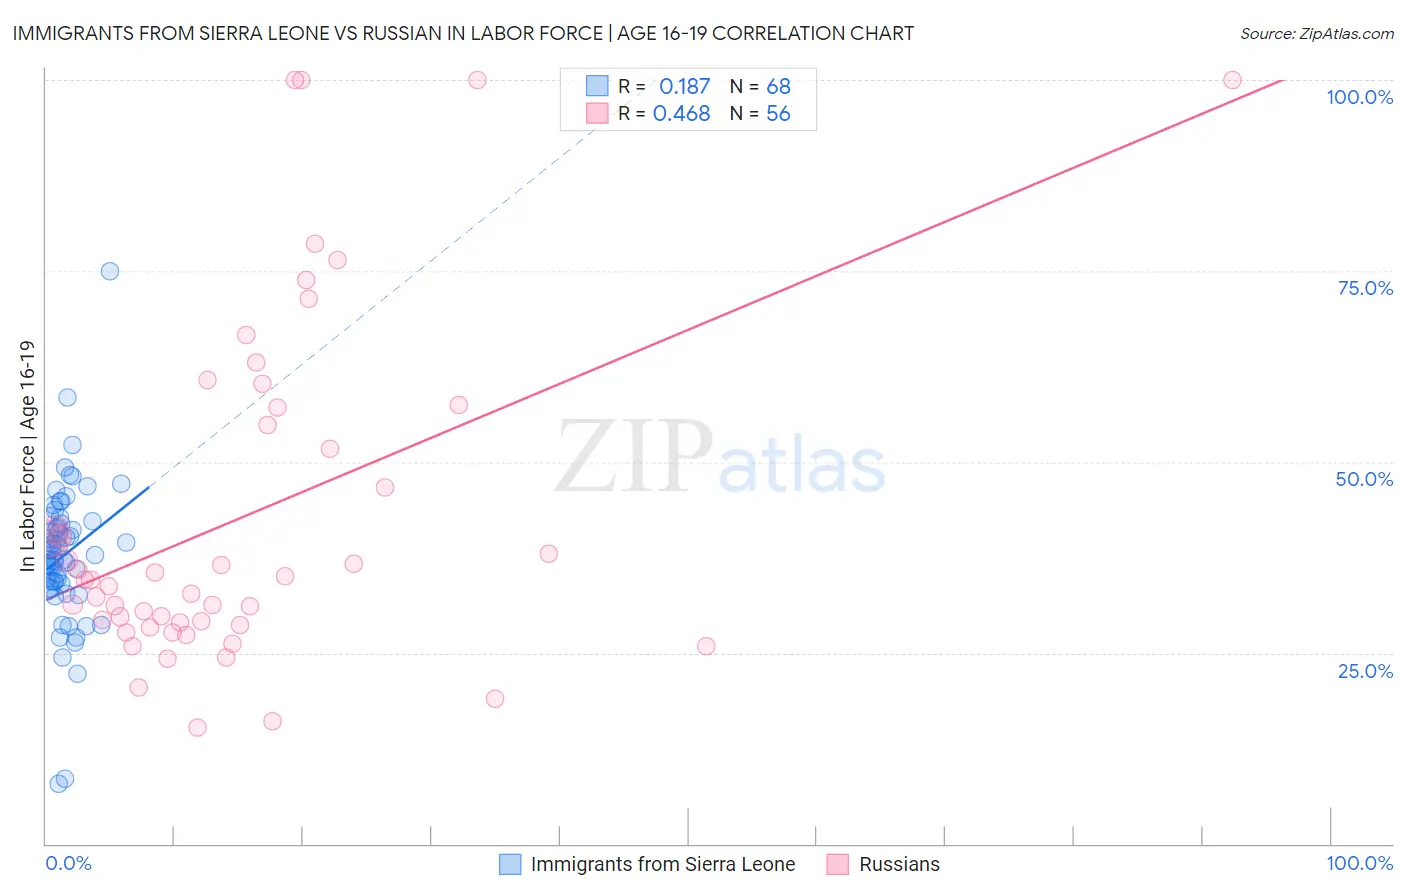
Immigrants from Sierra Leone vs Russian In Labor Force | Age 16-19 Correlation Chart
The statistical analysis conducted on geographies consisting of 101,607,840 people shows a poor positive correlation between the proportion of Immigrants from Sierra Leone and labor force participation rate among population between the ages 16 and 19 in the United States with a correlation coefficient (R) of 0.187 and weighted average of 37.3%. Similarly, the statistical analysis conducted on geographies consisting of 510,287,384 people shows a moderate positive correlation between the proportion of Russians and labor force participation rate among population between the ages 16 and 19 in the United States with a correlation coefficient (R) of 0.468 and weighted average of 36.7%, a difference of 1.7%.
In Labor Force | Age 16-19 Correlation Summary
| Measurement | Immigrants from Sierra Leone | Russian |
| Minimum | 7.9% | 15.3% |
| Maximum | 75.0% | 100.0% |
| Range | 67.1% | 84.7% |
| Mean | 37.8% | 42.9% |
| Median | 38.1% | 34.6% |
| Interquartile 25% (IQ1) | 34.2% | 28.8% |
| Interquartile 75% (IQ3) | 42.1% | 56.0% |
| Interquartile Range (IQR) | 7.9% | 27.2% |
| Standard Deviation (Sample) | 9.5% | 22.2% |
| Standard Deviation (Population) | 9.5% | 22.0% |
Similar Demographics by In Labor Force | Age 16-19
Demographics Similar to Immigrants from Sierra Leone by In Labor Force | Age 16-19
In terms of in labor force | age 16-19, the demographic groups most similar to Immigrants from Sierra Leone are Immigrants from Poland (37.3%, a difference of 0.070%), Tsimshian (37.4%, a difference of 0.10%), Native Hawaiian (37.4%, a difference of 0.13%), Arapaho (37.3%, a difference of 0.15%), and Immigrants from Bulgaria (37.3%, a difference of 0.17%).
| Demographics | Rating | Rank | In Labor Force | Age 16-19 |
| Paiute | 89.3 /100 | #145 | Excellent 37.5% |
| Immigrants | Western Europe | 88.9 /100 | #146 | Excellent 37.5% |
| Brazilians | 88.7 /100 | #147 | Excellent 37.5% |
| Romanians | 87.3 /100 | #148 | Excellent 37.5% |
| Native Hawaiians | 85.0 /100 | #149 | Excellent 37.4% |
| Tsimshian | 84.7 /100 | #150 | Excellent 37.4% |
| Immigrants | Poland | 84.4 /100 | #151 | Excellent 37.3% |
| Immigrants | Sierra Leone | 83.6 /100 | #152 | Excellent 37.3% |
| Arapaho | 81.8 /100 | #153 | Excellent 37.3% |
| Immigrants | Bulgaria | 81.6 /100 | #154 | Excellent 37.3% |
| Immigrants | Lithuania | 80.7 /100 | #155 | Excellent 37.2% |
| Kiowa | 80.4 /100 | #156 | Excellent 37.2% |
| Immigrants | Brazil | 76.5 /100 | #157 | Good 37.1% |
| Ute | 75.7 /100 | #158 | Good 37.1% |
| Yaqui | 74.4 /100 | #159 | Good 37.1% |
Demographics Similar to Russians by In Labor Force | Age 16-19
In terms of in labor force | age 16-19, the demographic groups most similar to Russians are Immigrants from Cambodia (36.7%, a difference of 0.040%), South African (36.7%, a difference of 0.040%), Immigrants from South Africa (36.8%, a difference of 0.15%), Immigrants from Latvia (36.8%, a difference of 0.21%), and Palestinian (36.8%, a difference of 0.29%).
| Demographics | Rating | Rank | In Labor Force | Age 16-19 |
| Immigrants | Western Africa | 66.7 /100 | #166 | Good 36.9% |
| Arabs | 63.6 /100 | #167 | Good 36.8% |
| Palestinians | 63.1 /100 | #168 | Good 36.8% |
| Immigrants | Latvia | 61.6 /100 | #169 | Good 36.8% |
| Immigrants | South Africa | 60.5 /100 | #170 | Good 36.8% |
| Immigrants | Cambodia | 58.4 /100 | #171 | Average 36.7% |
| South Africans | 58.3 /100 | #172 | Average 36.7% |
| Russians | 57.5 /100 | #173 | Average 36.7% |
| Immigrants | Czechoslovakia | 50.0 /100 | #174 | Average 36.6% |
| Natives/Alaskans | 49.0 /100 | #175 | Average 36.6% |
| Albanians | 48.8 /100 | #176 | Average 36.5% |
| Immigrants | Northern Europe | 46.6 /100 | #177 | Average 36.5% |
| Blacks/African Americans | 45.1 /100 | #178 | Average 36.5% |
| Immigrants | Southern Europe | 43.3 /100 | #179 | Average 36.4% |
| Immigrants | Morocco | 41.1 /100 | #180 | Average 36.4% |