Yaqui vs Palestinian In Labor Force | Age 45-54
COMPARE
Yaqui
Palestinian
In Labor Force | Age 45-54
In Labor Force | Age 45-54 Comparison
Yaqui
Palestinians
78.9%
IN LABOR FORCE | AGE 45-54
0.0/ 100
METRIC RATING
320th/ 347
METRIC RANK
83.3%
IN LABOR FORCE | AGE 45-54
94.8/ 100
METRIC RATING
97th/ 347
METRIC RANK
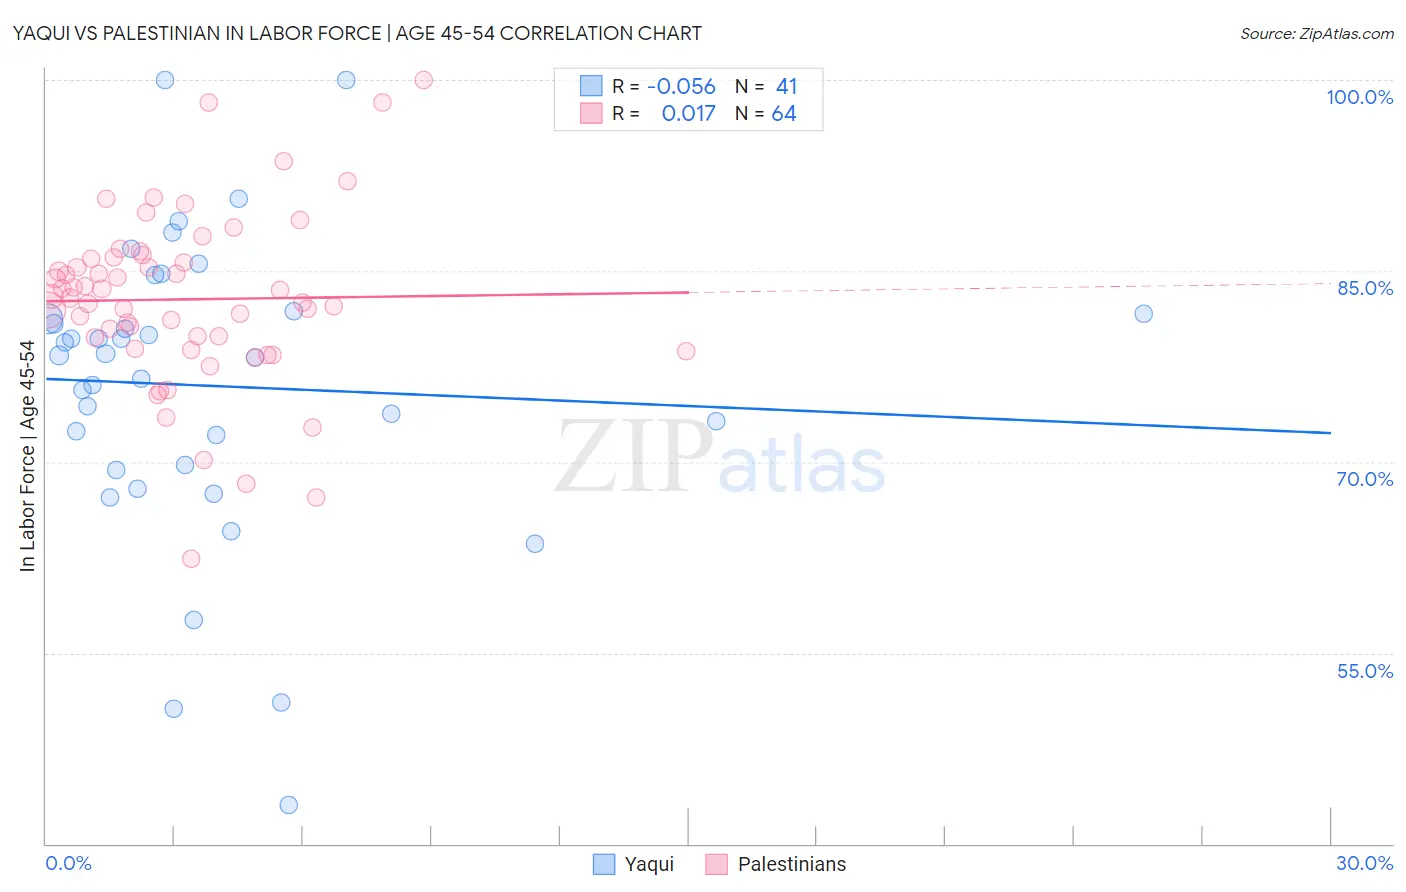
Yaqui vs Palestinian In Labor Force | Age 45-54 Correlation Chart
The statistical analysis conducted on geographies consisting of 107,713,051 people shows a slight negative correlation between the proportion of Yaqui and labor force participation rate among population between the ages 45 and 54 in the United States with a correlation coefficient (R) of -0.056 and weighted average of 78.9%. Similarly, the statistical analysis conducted on geographies consisting of 216,394,682 people shows no correlation between the proportion of Palestinians and labor force participation rate among population between the ages 45 and 54 in the United States with a correlation coefficient (R) of 0.017 and weighted average of 83.3%, a difference of 5.6%.
In Labor Force | Age 45-54 Correlation Summary
| Measurement | Yaqui | Palestinian |
| Minimum | 43.0% | 62.4% |
| Maximum | 100.0% | 100.0% |
| Range | 57.0% | 37.6% |
| Mean | 76.0% | 82.8% |
| Median | 78.4% | 82.9% |
| Interquartile 25% (IQ1) | 69.6% | 79.4% |
| Interquartile 75% (IQ3) | 81.7% | 86.0% |
| Interquartile Range (IQR) | 12.1% | 6.7% |
| Standard Deviation (Sample) | 11.8% | 6.9% |
| Standard Deviation (Population) | 11.7% | 6.8% |
Similar Demographics by In Labor Force | Age 45-54
Demographics Similar to Yaqui by In Labor Force | Age 45-54
In terms of in labor force | age 45-54, the demographic groups most similar to Yaqui are Cherokee (79.0%, a difference of 0.10%), Chickasaw (79.0%, a difference of 0.21%), Yup'ik (78.6%, a difference of 0.30%), Comanche (79.2%, a difference of 0.38%), and Shoshone (79.3%, a difference of 0.52%).
| Demographics | Rating | Rank | In Labor Force | Age 45-54 |
| Colville | 0.0 /100 | #313 | Tragic 79.5% |
| Ottawa | 0.0 /100 | #314 | Tragic 79.5% |
| Blacks/African Americans | 0.0 /100 | #315 | Tragic 79.3% |
| Shoshone | 0.0 /100 | #316 | Tragic 79.3% |
| Comanche | 0.0 /100 | #317 | Tragic 79.2% |
| Chickasaw | 0.0 /100 | #318 | Tragic 79.0% |
| Cherokee | 0.0 /100 | #319 | Tragic 79.0% |
| Yaqui | 0.0 /100 | #320 | Tragic 78.9% |
| Yup'ik | 0.0 /100 | #321 | Tragic 78.6% |
| Crow | 0.0 /100 | #322 | Tragic 78.3% |
| Kiowa | 0.0 /100 | #323 | Tragic 78.3% |
| Dutch West Indians | 0.0 /100 | #324 | Tragic 78.2% |
| Choctaw | 0.0 /100 | #325 | Tragic 78.2% |
| Seminole | 0.0 /100 | #326 | Tragic 78.1% |
| Cajuns | 0.0 /100 | #327 | Tragic 78.1% |
Demographics Similar to Palestinians by In Labor Force | Age 45-54
In terms of in labor force | age 45-54, the demographic groups most similar to Palestinians are Immigrants from Argentina (83.3%, a difference of 0.0%), Immigrants from Kuwait (83.3%, a difference of 0.0%), Argentinean (83.3%, a difference of 0.010%), Maltese (83.3%, a difference of 0.010%), and Danish (83.3%, a difference of 0.020%).
| Demographics | Rating | Rank | In Labor Force | Age 45-54 |
| Immigrants | Japan | 95.5 /100 | #90 | Exceptional 83.3% |
| South Americans | 95.5 /100 | #91 | Exceptional 83.3% |
| Danes | 95.3 /100 | #92 | Exceptional 83.3% |
| Italians | 95.1 /100 | #93 | Exceptional 83.3% |
| Argentineans | 94.9 /100 | #94 | Exceptional 83.3% |
| Immigrants | Argentina | 94.9 /100 | #95 | Exceptional 83.3% |
| Immigrants | Kuwait | 94.8 /100 | #96 | Exceptional 83.3% |
| Palestinians | 94.8 /100 | #97 | Exceptional 83.3% |
| Maltese | 94.4 /100 | #98 | Exceptional 83.3% |
| Immigrants | Middle Africa | 94.3 /100 | #99 | Exceptional 83.3% |
| Mongolians | 94.2 /100 | #100 | Exceptional 83.3% |
| Immigrants | Belarus | 94.1 /100 | #101 | Exceptional 83.3% |
| Immigrants | Singapore | 93.9 /100 | #102 | Exceptional 83.3% |
| Albanians | 93.9 /100 | #103 | Exceptional 83.3% |
| Immigrants | Romania | 93.8 /100 | #104 | Exceptional 83.3% |