Immigrants from Iran vs Immigrants from Trinidad and Tobago In Labor Force | Age 45-54
COMPARE
Immigrants from Iran
Immigrants from Trinidad and Tobago
In Labor Force | Age 45-54
In Labor Force | Age 45-54 Comparison
Immigrants from Iran
Immigrants from Trinidad and Tobago
83.1%
IN LABOR FORCE | AGE 45-54
87.2/ 100
METRIC RATING
125th/ 347
METRIC RANK
82.0%
IN LABOR FORCE | AGE 45-54
1.2/ 100
METRIC RATING
237th/ 347
METRIC RANK
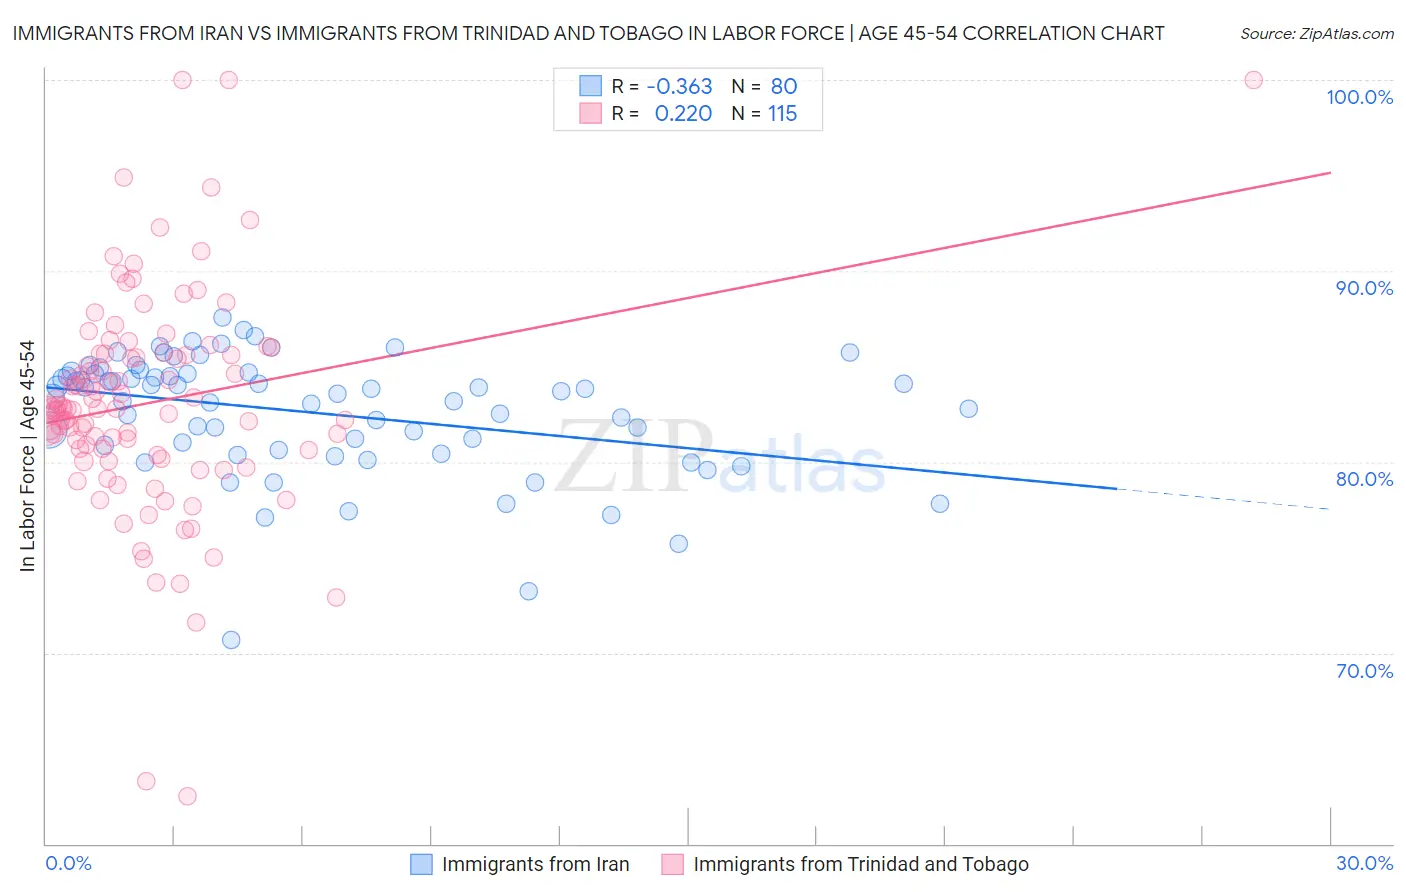
Immigrants from Iran vs Immigrants from Trinidad and Tobago In Labor Force | Age 45-54 Correlation Chart
The statistical analysis conducted on geographies consisting of 279,820,433 people shows a mild negative correlation between the proportion of Immigrants from Iran and labor force participation rate among population between the ages 45 and 54 in the United States with a correlation coefficient (R) of -0.363 and weighted average of 83.1%. Similarly, the statistical analysis conducted on geographies consisting of 223,484,344 people shows a weak positive correlation between the proportion of Immigrants from Trinidad and Tobago and labor force participation rate among population between the ages 45 and 54 in the United States with a correlation coefficient (R) of 0.220 and weighted average of 82.0%, a difference of 1.4%.
In Labor Force | Age 45-54 Correlation Summary
| Measurement | Immigrants from Iran | Immigrants from Trinidad and Tobago |
| Minimum | 70.7% | 62.5% |
| Maximum | 87.6% | 100.0% |
| Range | 16.9% | 37.5% |
| Mean | 82.6% | 83.1% |
| Median | 83.7% | 82.8% |
| Interquartile 25% (IQ1) | 80.8% | 80.6% |
| Interquartile 75% (IQ3) | 84.6% | 85.6% |
| Interquartile Range (IQR) | 3.9% | 5.0% |
| Standard Deviation (Sample) | 3.1% | 5.8% |
| Standard Deviation (Population) | 3.1% | 5.8% |
Similar Demographics by In Labor Force | Age 45-54
Demographics Similar to Immigrants from Iran by In Labor Force | Age 45-54
In terms of in labor force | age 45-54, the demographic groups most similar to Immigrants from Iran are Tongan (83.1%, a difference of 0.020%), Bermudan (83.1%, a difference of 0.020%), Immigrants from Belgium (83.1%, a difference of 0.020%), Immigrants from Vietnam (83.1%, a difference of 0.030%), and Uruguayan (83.1%, a difference of 0.040%).
| Demographics | Rating | Rank | In Labor Force | Age 45-54 |
| Immigrants | Europe | 90.7 /100 | #118 | Exceptional 83.2% |
| Immigrants | Uruguay | 90.2 /100 | #119 | Exceptional 83.2% |
| Immigrants | Russia | 90.1 /100 | #120 | Exceptional 83.2% |
| Uruguayans | 89.4 /100 | #121 | Excellent 83.1% |
| Immigrants | Vietnam | 88.9 /100 | #122 | Excellent 83.1% |
| Tongans | 88.2 /100 | #123 | Excellent 83.1% |
| Bermudans | 88.0 /100 | #124 | Excellent 83.1% |
| Immigrants | Iran | 87.2 /100 | #125 | Excellent 83.1% |
| Immigrants | Belgium | 86.4 /100 | #126 | Excellent 83.1% |
| Immigrants | Jordan | 85.2 /100 | #127 | Excellent 83.1% |
| Germans | 85.1 /100 | #128 | Excellent 83.1% |
| Immigrants | Northern Europe | 85.1 /100 | #129 | Excellent 83.1% |
| Immigrants | Israel | 84.7 /100 | #130 | Excellent 83.1% |
| Finns | 83.3 /100 | #131 | Excellent 83.1% |
| Immigrants | Ukraine | 82.9 /100 | #132 | Excellent 83.0% |
Demographics Similar to Immigrants from Trinidad and Tobago by In Labor Force | Age 45-54
In terms of in labor force | age 45-54, the demographic groups most similar to Immigrants from Trinidad and Tobago are Subsaharan African (82.0%, a difference of 0.010%), Basque (82.0%, a difference of 0.010%), Trinidadian and Tobagonian (81.9%, a difference of 0.010%), Immigrants from Thailand (81.9%, a difference of 0.030%), and Immigrants from El Salvador (81.9%, a difference of 0.040%).
| Demographics | Rating | Rank | In Labor Force | Age 45-54 |
| Jamaicans | 1.8 /100 | #230 | Tragic 82.0% |
| Immigrants | Senegal | 1.7 /100 | #231 | Tragic 82.0% |
| Immigrants | Portugal | 1.7 /100 | #232 | Tragic 82.0% |
| Malaysians | 1.7 /100 | #233 | Tragic 82.0% |
| Salvadorans | 1.7 /100 | #234 | Tragic 82.0% |
| Sub-Saharan Africans | 1.2 /100 | #235 | Tragic 82.0% |
| Basques | 1.2 /100 | #236 | Tragic 82.0% |
| Immigrants | Trinidad and Tobago | 1.2 /100 | #237 | Tragic 82.0% |
| Trinidadians and Tobagonians | 1.1 /100 | #238 | Tragic 81.9% |
| Immigrants | Thailand | 1.0 /100 | #239 | Tragic 81.9% |
| Immigrants | El Salvador | 1.0 /100 | #240 | Tragic 81.9% |
| Immigrants | Cambodia | 0.8 /100 | #241 | Tragic 81.9% |
| Whites/Caucasians | 0.7 /100 | #242 | Tragic 81.9% |
| Samoans | 0.6 /100 | #243 | Tragic 81.8% |
| Celtics | 0.4 /100 | #244 | Tragic 81.8% |