Immigrants from France vs Immigrants from Kenya In Labor Force | Age > 16
COMPARE
Immigrants from France
Immigrants from Kenya
In Labor Force | Age > 16
In Labor Force | Age > 16 Comparison
Immigrants from France
Immigrants from Kenya
65.7%
IN LABOR FORCE | AGE > 16
96.4/ 100
METRIC RATING
119th/ 347
METRIC RANK
67.6%
IN LABOR FORCE | AGE > 16
100.0/ 100
METRIC RATING
20th/ 347
METRIC RANK
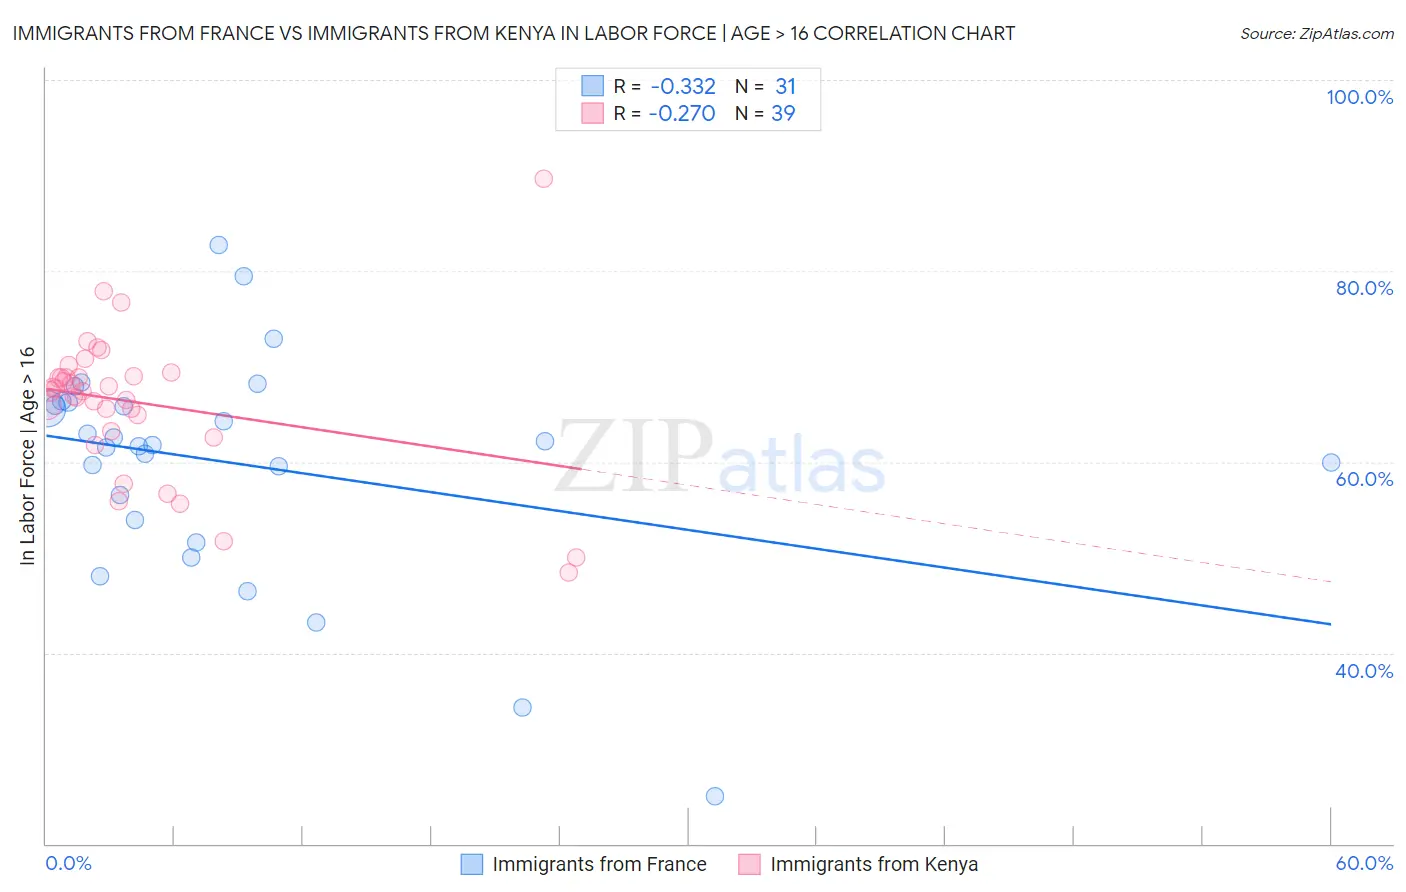
Immigrants from France vs Immigrants from Kenya In Labor Force | Age > 16 Correlation Chart
The statistical analysis conducted on geographies consisting of 287,921,196 people shows a mild negative correlation between the proportion of Immigrants from France and labor force participation rate among population ages 16 and over in the United States with a correlation coefficient (R) of -0.332 and weighted average of 65.7%. Similarly, the statistical analysis conducted on geographies consisting of 218,088,200 people shows a weak negative correlation between the proportion of Immigrants from Kenya and labor force participation rate among population ages 16 and over in the United States with a correlation coefficient (R) of -0.270 and weighted average of 67.6%, a difference of 2.8%.
In Labor Force | Age > 16 Correlation Summary
| Measurement | Immigrants from France | Immigrants from Kenya |
| Minimum | 25.0% | 48.4% |
| Maximum | 82.7% | 89.6% |
| Range | 57.7% | 41.2% |
| Mean | 59.9% | 66.2% |
| Median | 61.8% | 67.4% |
| Interquartile 25% (IQ1) | 53.9% | 63.2% |
| Interquartile 75% (IQ3) | 66.3% | 69.0% |
| Interquartile Range (IQR) | 12.4% | 5.8% |
| Standard Deviation (Sample) | 11.8% | 7.6% |
| Standard Deviation (Population) | 11.6% | 7.5% |
Similar Demographics by In Labor Force | Age > 16
Demographics Similar to Immigrants from France by In Labor Force | Age > 16
In terms of in labor force | age > 16, the demographic groups most similar to Immigrants from France are Immigrants from Iran (65.7%, a difference of 0.010%), Immigrants from Thailand (65.7%, a difference of 0.010%), Argentinean (65.7%, a difference of 0.020%), Immigrants from Hong Kong (65.7%, a difference of 0.020%), and Immigrants from Indonesia (65.7%, a difference of 0.030%).
| Demographics | Rating | Rank | In Labor Force | Age > 16 |
| Laotians | 97.4 /100 | #112 | Exceptional 65.8% |
| Pakistanis | 97.1 /100 | #113 | Exceptional 65.8% |
| Hondurans | 97.1 /100 | #114 | Exceptional 65.8% |
| Immigrants | Indonesia | 96.8 /100 | #115 | Exceptional 65.7% |
| Argentineans | 96.7 /100 | #116 | Exceptional 65.7% |
| Immigrants | Iran | 96.6 /100 | #117 | Exceptional 65.7% |
| Immigrants | Thailand | 96.6 /100 | #118 | Exceptional 65.7% |
| Immigrants | France | 96.4 /100 | #119 | Exceptional 65.7% |
| Immigrants | Hong Kong | 96.2 /100 | #120 | Exceptional 65.7% |
| New Zealanders | 96.0 /100 | #121 | Exceptional 65.7% |
| Immigrants | Ecuador | 95.9 /100 | #122 | Exceptional 65.7% |
| Immigrants | Iraq | 95.5 /100 | #123 | Exceptional 65.7% |
| Iraqis | 95.4 /100 | #124 | Exceptional 65.7% |
| Norwegians | 95.3 /100 | #125 | Exceptional 65.7% |
| Koreans | 95.3 /100 | #126 | Exceptional 65.7% |
Demographics Similar to Immigrants from Kenya by In Labor Force | Age > 16
In terms of in labor force | age > 16, the demographic groups most similar to Immigrants from Kenya are Tongan (67.5%, a difference of 0.020%), Kenyan (67.6%, a difference of 0.050%), Immigrants from Uganda (67.5%, a difference of 0.080%), Immigrants from Liberia (67.6%, a difference of 0.090%), and Immigrants from India (67.6%, a difference of 0.10%).
| Demographics | Rating | Rank | In Labor Force | Age > 16 |
| Immigrants | Nepal | 100.0 /100 | #13 | Exceptional 68.0% |
| Liberians | 100.0 /100 | #14 | Exceptional 67.8% |
| Immigrants | Middle Africa | 100.0 /100 | #15 | Exceptional 67.7% |
| Immigrants | Sudan | 100.0 /100 | #16 | Exceptional 67.7% |
| Immigrants | India | 100.0 /100 | #17 | Exceptional 67.6% |
| Immigrants | Liberia | 100.0 /100 | #18 | Exceptional 67.6% |
| Kenyans | 100.0 /100 | #19 | Exceptional 67.6% |
| Immigrants | Kenya | 100.0 /100 | #20 | Exceptional 67.6% |
| Tongans | 100.0 /100 | #21 | Exceptional 67.5% |
| Immigrants | Uganda | 100.0 /100 | #22 | Exceptional 67.5% |
| Cambodians | 100.0 /100 | #23 | Exceptional 67.4% |
| Ugandans | 100.0 /100 | #24 | Exceptional 67.4% |
| Immigrants | Africa | 100.0 /100 | #25 | Exceptional 67.4% |
| Immigrants | Cabo Verde | 100.0 /100 | #26 | Exceptional 67.3% |
| Zimbabweans | 100.0 /100 | #27 | Exceptional 67.3% |