Immigrants from Micronesia vs Nicaraguan In Labor Force | Age 30-34
COMPARE
Immigrants from Micronesia
Nicaraguan
In Labor Force | Age 30-34
In Labor Force | Age 30-34 Comparison
Immigrants from Micronesia
Nicaraguans
82.4%
IN LABOR FORCE | AGE 30-34
0.0/ 100
METRIC RATING
303rd/ 347
METRIC RANK
83.9%
IN LABOR FORCE | AGE 30-34
0.6/ 100
METRIC RATING
251st/ 347
METRIC RANK
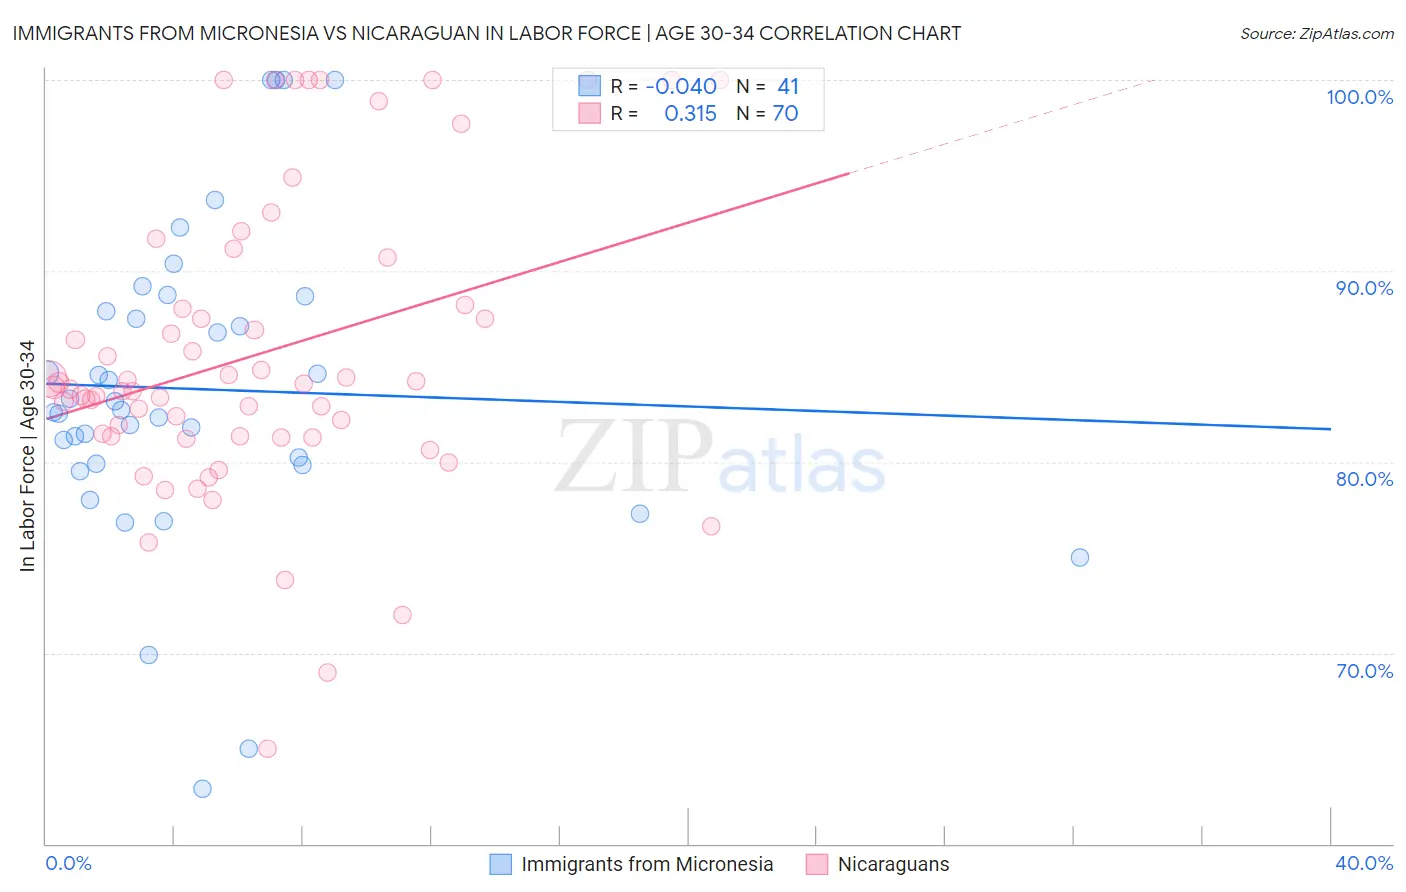
Immigrants from Micronesia vs Nicaraguan In Labor Force | Age 30-34 Correlation Chart
The statistical analysis conducted on geographies consisting of 61,597,268 people shows no correlation between the proportion of Immigrants from Micronesia and labor force participation rate among population between the ages 30 and 34 in the United States with a correlation coefficient (R) of -0.040 and weighted average of 82.4%. Similarly, the statistical analysis conducted on geographies consisting of 285,621,495 people shows a mild positive correlation between the proportion of Nicaraguans and labor force participation rate among population between the ages 30 and 34 in the United States with a correlation coefficient (R) of 0.315 and weighted average of 83.9%, a difference of 1.9%.
In Labor Force | Age 30-34 Correlation Summary
| Measurement | Immigrants from Micronesia | Nicaraguan |
| Minimum | 62.9% | 65.0% |
| Maximum | 100.0% | 100.0% |
| Range | 37.1% | 35.0% |
| Mean | 83.8% | 85.6% |
| Median | 82.7% | 83.8% |
| Interquartile 25% (IQ1) | 79.9% | 81.3% |
| Interquartile 75% (IQ3) | 88.3% | 88.2% |
| Interquartile Range (IQR) | 8.4% | 6.9% |
| Standard Deviation (Sample) | 8.3% | 7.8% |
| Standard Deviation (Population) | 8.1% | 7.8% |
Similar Demographics by In Labor Force | Age 30-34
Demographics Similar to Immigrants from Micronesia by In Labor Force | Age 30-34
In terms of in labor force | age 30-34, the demographic groups most similar to Immigrants from Micronesia are Ottawa (82.4%, a difference of 0.010%), Hispanic or Latino (82.4%, a difference of 0.040%), Hmong (82.4%, a difference of 0.050%), Tlingit-Haida (82.3%, a difference of 0.080%), and Immigrants from Central America (82.5%, a difference of 0.11%).
| Demographics | Rating | Rank | In Labor Force | Age 30-34 |
| Chippewa | 0.0 /100 | #296 | Tragic 82.6% |
| Comanche | 0.0 /100 | #297 | Tragic 82.6% |
| Aleuts | 0.0 /100 | #298 | Tragic 82.6% |
| Immigrants | Central America | 0.0 /100 | #299 | Tragic 82.5% |
| Hmong | 0.0 /100 | #300 | Tragic 82.4% |
| Hispanics or Latinos | 0.0 /100 | #301 | Tragic 82.4% |
| Ottawa | 0.0 /100 | #302 | Tragic 82.4% |
| Immigrants | Micronesia | 0.0 /100 | #303 | Tragic 82.4% |
| Tlingit-Haida | 0.0 /100 | #304 | Tragic 82.3% |
| Osage | 0.0 /100 | #305 | Tragic 82.3% |
| Spanish American Indians | 0.0 /100 | #306 | Tragic 82.2% |
| Menominee | 0.0 /100 | #307 | Tragic 82.2% |
| Puget Sound Salish | 0.0 /100 | #308 | Tragic 82.1% |
| Immigrants | Mexico | 0.0 /100 | #309 | Tragic 82.0% |
| Cajuns | 0.0 /100 | #310 | Tragic 82.0% |
Demographics Similar to Nicaraguans by In Labor Force | Age 30-34
In terms of in labor force | age 30-34, the demographic groups most similar to Nicaraguans are Bahamian (83.9%, a difference of 0.0%), Immigrants from Nicaragua (83.9%, a difference of 0.010%), Immigrants from Iraq (83.9%, a difference of 0.020%), Immigrants from St. Vincent and the Grenadines (83.9%, a difference of 0.030%), and Portuguese (84.0%, a difference of 0.040%).
| Demographics | Rating | Rank | In Labor Force | Age 30-34 |
| Basques | 0.9 /100 | #244 | Tragic 84.0% |
| Immigrants | Venezuela | 0.9 /100 | #245 | Tragic 84.0% |
| Central Americans | 0.9 /100 | #246 | Tragic 84.0% |
| British West Indians | 0.8 /100 | #247 | Tragic 84.0% |
| Portuguese | 0.8 /100 | #248 | Tragic 84.0% |
| Immigrants | Dominica | 0.7 /100 | #249 | Tragic 84.0% |
| Immigrants | Iraq | 0.7 /100 | #250 | Tragic 83.9% |
| Nicaraguans | 0.6 /100 | #251 | Tragic 83.9% |
| Bahamians | 0.6 /100 | #252 | Tragic 83.9% |
| Immigrants | Nicaragua | 0.6 /100 | #253 | Tragic 83.9% |
| Immigrants | St. Vincent and the Grenadines | 0.5 /100 | #254 | Tragic 83.9% |
| Whites/Caucasians | 0.5 /100 | #255 | Tragic 83.9% |
| Immigrants | Lebanon | 0.4 /100 | #256 | Tragic 83.9% |
| Iraqis | 0.3 /100 | #257 | Tragic 83.8% |
| Hondurans | 0.3 /100 | #258 | Tragic 83.8% |