Yakama vs Crow In Labor Force | Age 16-19
COMPARE
Yakama
Crow
In Labor Force | Age 16-19
In Labor Force | Age 16-19 Comparison
Yakama
Crow
36.9%
IN LABOR FORCE | AGE 16-19
66.9/ 100
METRIC RATING
165th/ 347
METRIC RANK
38.5%
IN LABOR FORCE | AGE 16-19
98.5/ 100
METRIC RATING
111th/ 347
METRIC RANK
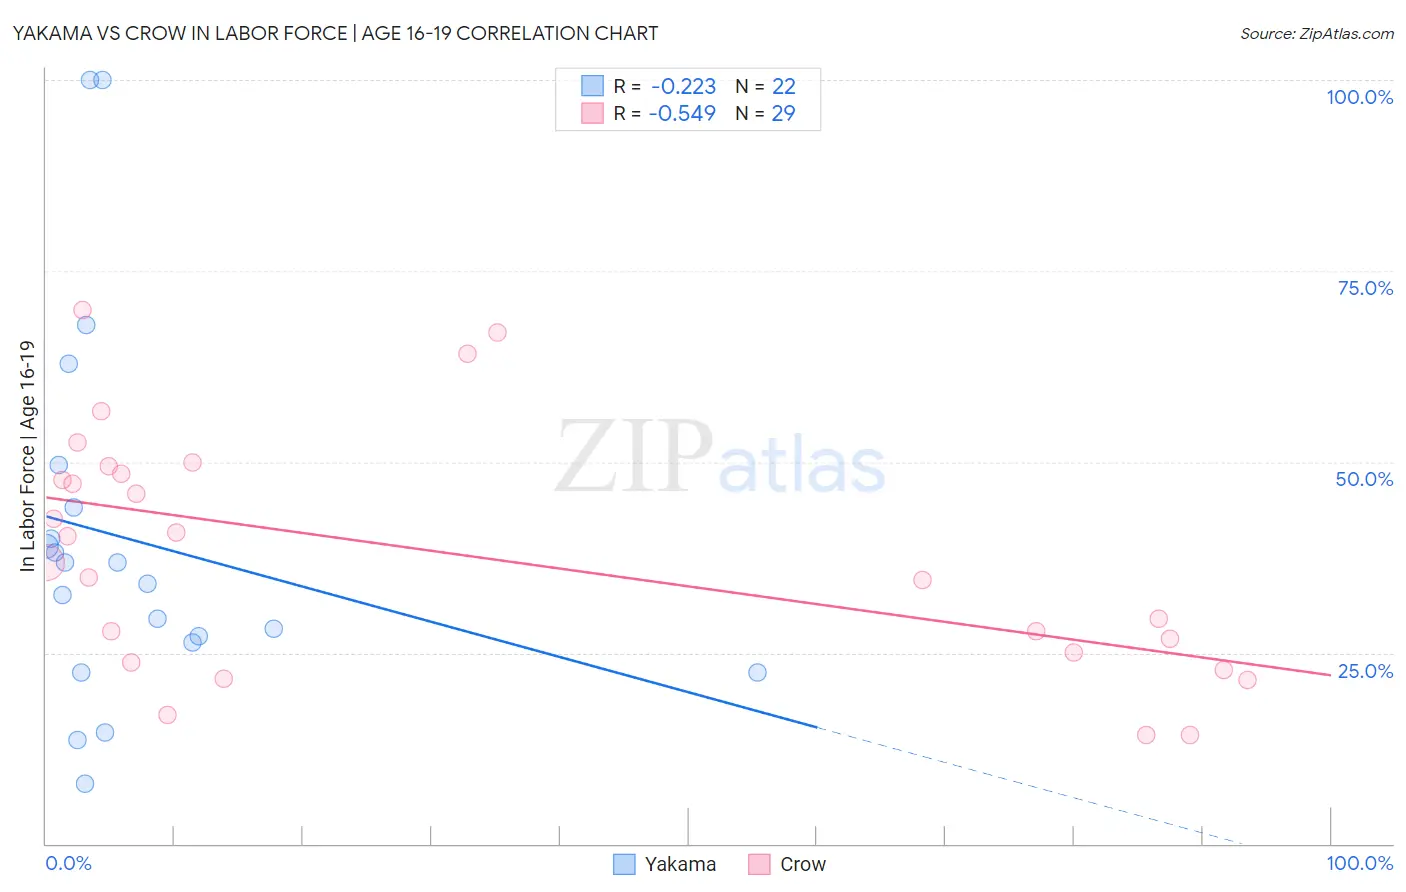
Yakama vs Crow In Labor Force | Age 16-19 Correlation Chart
The statistical analysis conducted on geographies consisting of 19,894,194 people shows a weak negative correlation between the proportion of Yakama and labor force participation rate among population between the ages 16 and 19 in the United States with a correlation coefficient (R) of -0.223 and weighted average of 36.9%. Similarly, the statistical analysis conducted on geographies consisting of 59,169,003 people shows a substantial negative correlation between the proportion of Crow and labor force participation rate among population between the ages 16 and 19 in the United States with a correlation coefficient (R) of -0.549 and weighted average of 38.5%, a difference of 4.3%.
In Labor Force | Age 16-19 Correlation Summary
| Measurement | Yakama | Crow |
| Minimum | 7.9% | 14.3% |
| Maximum | 100.0% | 69.9% |
| Range | 92.1% | 55.6% |
| Mean | 39.7% | 38.0% |
| Median | 35.4% | 36.8% |
| Interquartile 25% (IQ1) | 26.4% | 24.4% |
| Interquartile 75% (IQ3) | 44.0% | 48.9% |
| Interquartile Range (IQR) | 17.6% | 24.6% |
| Standard Deviation (Sample) | 24.2% | 15.7% |
| Standard Deviation (Population) | 23.7% | 15.4% |
Similar Demographics by In Labor Force | Age 16-19
Demographics Similar to Yakama by In Labor Force | Age 16-19
In terms of in labor force | age 16-19, the demographic groups most similar to Yakama are Immigrants from Western Africa (36.9%, a difference of 0.010%), Immigrants from Kuwait (36.9%, a difference of 0.11%), Bermudan (36.9%, a difference of 0.14%), Immigrants from Jordan (36.9%, a difference of 0.15%), and Arab (36.8%, a difference of 0.18%).
| Demographics | Rating | Rank | In Labor Force | Age 16-19 |
| Ute | 75.7 /100 | #158 | Good 37.1% |
| Yaqui | 74.4 /100 | #159 | Good 37.1% |
| Immigrants | Saudi Arabia | 73.9 /100 | #160 | Good 37.0% |
| Cambodians | 71.5 /100 | #161 | Good 37.0% |
| Immigrants | Jordan | 69.5 /100 | #162 | Good 36.9% |
| Bermudans | 69.3 /100 | #163 | Good 36.9% |
| Immigrants | Kuwait | 68.9 /100 | #164 | Good 36.9% |
| Yakama | 66.9 /100 | #165 | Good 36.9% |
| Immigrants | Western Africa | 66.7 /100 | #166 | Good 36.9% |
| Arabs | 63.6 /100 | #167 | Good 36.8% |
| Palestinians | 63.1 /100 | #168 | Good 36.8% |
| Immigrants | Latvia | 61.6 /100 | #169 | Good 36.8% |
| Immigrants | South Africa | 60.5 /100 | #170 | Good 36.8% |
| Immigrants | Cambodia | 58.4 /100 | #171 | Average 36.7% |
| South Africans | 58.3 /100 | #172 | Average 36.7% |
Demographics Similar to Crow by In Labor Force | Age 16-19
In terms of in labor force | age 16-19, the demographic groups most similar to Crow are Immigrants from Scotland (38.5%, a difference of 0.010%), Maltese (38.5%, a difference of 0.060%), Subsaharan African (38.4%, a difference of 0.14%), Immigrants from Ethiopia (38.6%, a difference of 0.18%), and Lebanese (38.6%, a difference of 0.18%).
| Demographics | Rating | Rank | In Labor Force | Age 16-19 |
| Immigrants | Eritrea | 99.0 /100 | #104 | Exceptional 38.7% |
| Iraqis | 98.9 /100 | #105 | Exceptional 38.6% |
| Delaware | 98.8 /100 | #106 | Exceptional 38.6% |
| Chinese | 98.8 /100 | #107 | Exceptional 38.6% |
| Immigrants | Ethiopia | 98.7 /100 | #108 | Exceptional 38.6% |
| Lebanese | 98.7 /100 | #109 | Exceptional 38.6% |
| Maltese | 98.6 /100 | #110 | Exceptional 38.5% |
| Crow | 98.5 /100 | #111 | Exceptional 38.5% |
| Immigrants | Scotland | 98.5 /100 | #112 | Exceptional 38.5% |
| Sub-Saharan Africans | 98.3 /100 | #113 | Exceptional 38.4% |
| Hawaiians | 98.2 /100 | #114 | Exceptional 38.4% |
| Bulgarians | 97.9 /100 | #115 | Exceptional 38.3% |
| Colville | 97.9 /100 | #116 | Exceptional 38.3% |
| Chickasaw | 97.8 /100 | #117 | Exceptional 38.3% |
| Immigrants | Nepal | 97.8 /100 | #118 | Exceptional 38.3% |