Yakama vs Crow Unemployment Among Women with Children Under 6 years
COMPARE
Yakama
Crow
Unemployment Among Women with Children Under 6 years
Unemployment Among Women with Children Under 6 years Comparison
Yakama
Crow
6.6%
UNEMPLOYMENT AMONG WOMEN WITH CHILDREN UNDER 6 YEARS
100.0/ 100
METRIC RATING
35th/ 347
METRIC RANK
14.6%
UNEMPLOYMENT AMONG WOMEN WITH CHILDREN UNDER 6 YEARS
0.0/ 100
METRIC RATING
343rd/ 347
METRIC RANK
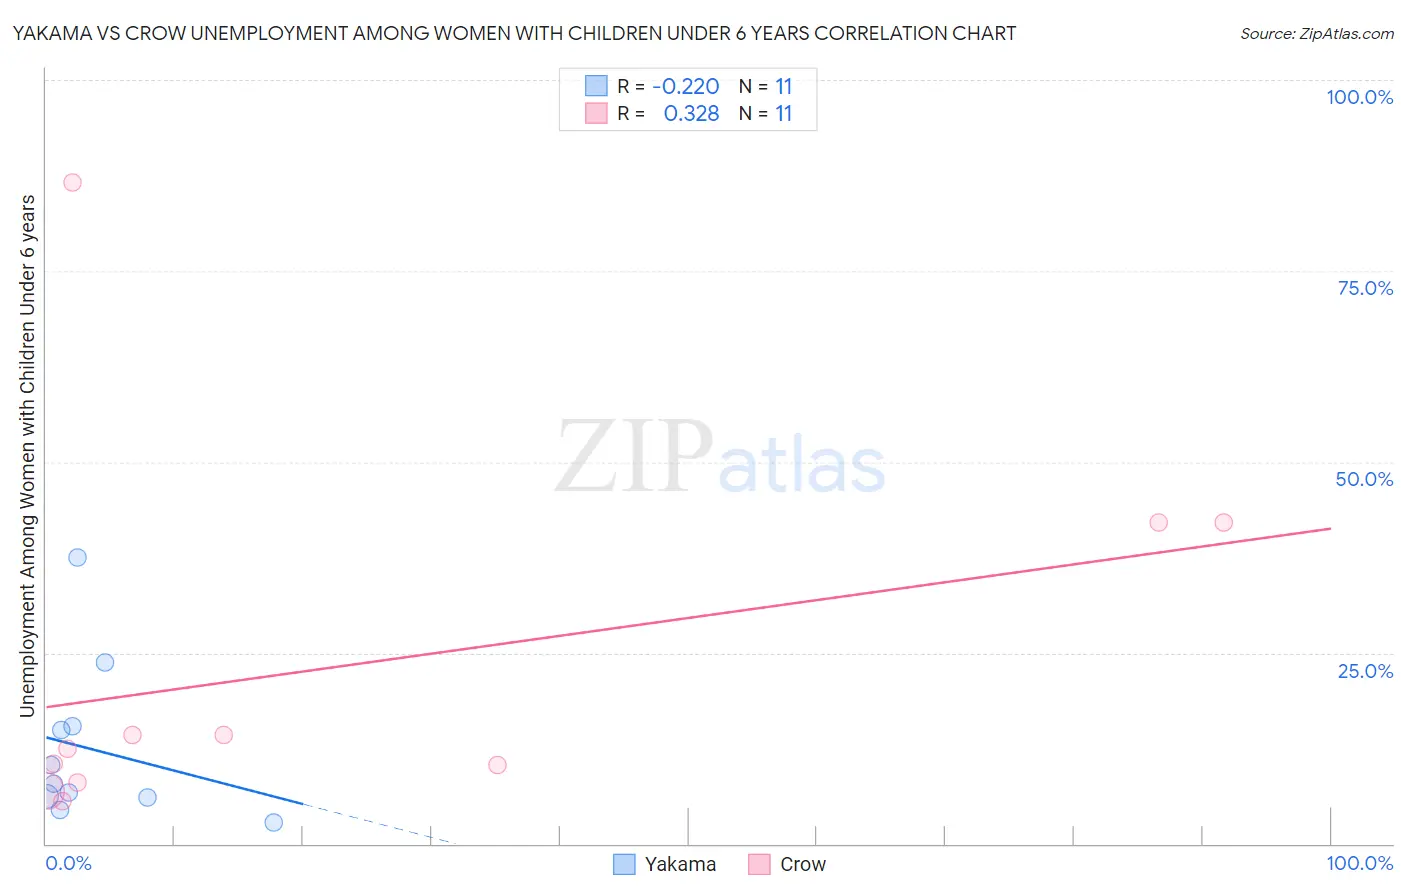
Yakama vs Crow Unemployment Among Women with Children Under 6 years Correlation Chart
The statistical analysis conducted on geographies consisting of 17,322,416 people shows a weak negative correlation between the proportion of Yakama and unemployment rate among women with children under the age of 6 in the United States with a correlation coefficient (R) of -0.220 and weighted average of 6.6%. Similarly, the statistical analysis conducted on geographies consisting of 53,848,847 people shows a mild positive correlation between the proportion of Crow and unemployment rate among women with children under the age of 6 in the United States with a correlation coefficient (R) of 0.328 and weighted average of 14.6%, a difference of 120.9%.
Unemployment Among Women with Children Under 6 years Correlation Summary
| Measurement | Yakama | Crow |
| Minimum | 2.8% | 5.6% |
| Maximum | 37.5% | 86.6% |
| Range | 34.7% | 81.1% |
| Mean | 12.3% | 23.0% |
| Median | 7.9% | 12.5% |
| Interquartile 25% (IQ1) | 6.0% | 8.1% |
| Interquartile 75% (IQ3) | 15.4% | 42.1% |
| Interquartile Range (IQR) | 9.4% | 34.0% |
| Standard Deviation (Sample) | 10.3% | 24.8% |
| Standard Deviation (Population) | 9.8% | 23.6% |
Similar Demographics by Unemployment Among Women with Children Under 6 years
Demographics Similar to Yakama by Unemployment Among Women with Children Under 6 years
In terms of unemployment among women with children under 6 years, the demographic groups most similar to Yakama are Luxembourger (6.6%, a difference of 0.070%), Immigrants from South Central Asia (6.6%, a difference of 0.27%), Immigrants from Vietnam (6.6%, a difference of 0.28%), Tsimshian (6.6%, a difference of 0.30%), and Sri Lankan (6.6%, a difference of 0.32%).
| Demographics | Rating | Rank | Unemployment Among Women with Children Under 6 years |
| Immigrants | Israel | 100.0 /100 | #28 | Exceptional 6.5% |
| Immigrants | Sweden | 100.0 /100 | #29 | Exceptional 6.6% |
| Immigrants | Belarus | 100.0 /100 | #30 | Exceptional 6.6% |
| Immigrants | Moldova | 100.0 /100 | #31 | Exceptional 6.6% |
| Tsimshian | 100.0 /100 | #32 | Exceptional 6.6% |
| Immigrants | Vietnam | 100.0 /100 | #33 | Exceptional 6.6% |
| Immigrants | South Central Asia | 100.0 /100 | #34 | Exceptional 6.6% |
| Yakama | 100.0 /100 | #35 | Exceptional 6.6% |
| Luxembourgers | 100.0 /100 | #36 | Exceptional 6.6% |
| Sri Lankans | 100.0 /100 | #37 | Exceptional 6.6% |
| Hmong | 100.0 /100 | #38 | Exceptional 6.7% |
| Immigrants | Russia | 100.0 /100 | #39 | Exceptional 6.7% |
| Asians | 100.0 /100 | #40 | Exceptional 6.7% |
| Immigrants | Indonesia | 99.9 /100 | #41 | Exceptional 6.7% |
| Immigrants | Cuba | 99.9 /100 | #42 | Exceptional 6.7% |
Demographics Similar to Crow by Unemployment Among Women with Children Under 6 years
In terms of unemployment among women with children under 6 years, the demographic groups most similar to Crow are Yuman (14.6%, a difference of 0.090%), Lumbee (13.8%, a difference of 6.1%), Immigrants from Yemen (13.5%, a difference of 8.5%), Navajo (13.5%, a difference of 8.5%), and Pima (13.4%, a difference of 8.9%).
| Demographics | Rating | Rank | Unemployment Among Women with Children Under 6 years |
| Natives/Alaskans | 0.0 /100 | #333 | Tragic 11.5% |
| Apache | 0.0 /100 | #334 | Tragic 12.3% |
| Puerto Ricans | 0.0 /100 | #335 | Tragic 12.5% |
| Shoshone | 0.0 /100 | #336 | Tragic 13.2% |
| Chippewa | 0.0 /100 | #337 | Tragic 13.3% |
| Pima | 0.0 /100 | #338 | Tragic 13.4% |
| Navajo | 0.0 /100 | #339 | Tragic 13.5% |
| Immigrants | Yemen | 0.0 /100 | #340 | Tragic 13.5% |
| Lumbee | 0.0 /100 | #341 | Tragic 13.8% |
| Yuman | 0.0 /100 | #342 | Tragic 14.6% |
| Crow | 0.0 /100 | #343 | Tragic 14.6% |
| Hopi | 0.0 /100 | #344 | Tragic 16.8% |
| Inupiat | 0.0 /100 | #345 | Tragic 17.7% |
| Arapaho | 0.0 /100 | #346 | Tragic 19.0% |
| Yup'ik | 0.0 /100 | #347 | Tragic 21.1% |