Hispanic or Latino vs Crow In Labor Force | Age 16-19
COMPARE
Hispanic or Latino
Crow
In Labor Force | Age 16-19
In Labor Force | Age 16-19 Comparison
Hispanics or Latinos
Crow
34.5%
IN LABOR FORCE | AGE 16-19
1.1/ 100
METRIC RATING
262nd/ 347
METRIC RANK
38.5%
IN LABOR FORCE | AGE 16-19
98.5/ 100
METRIC RATING
111th/ 347
METRIC RANK
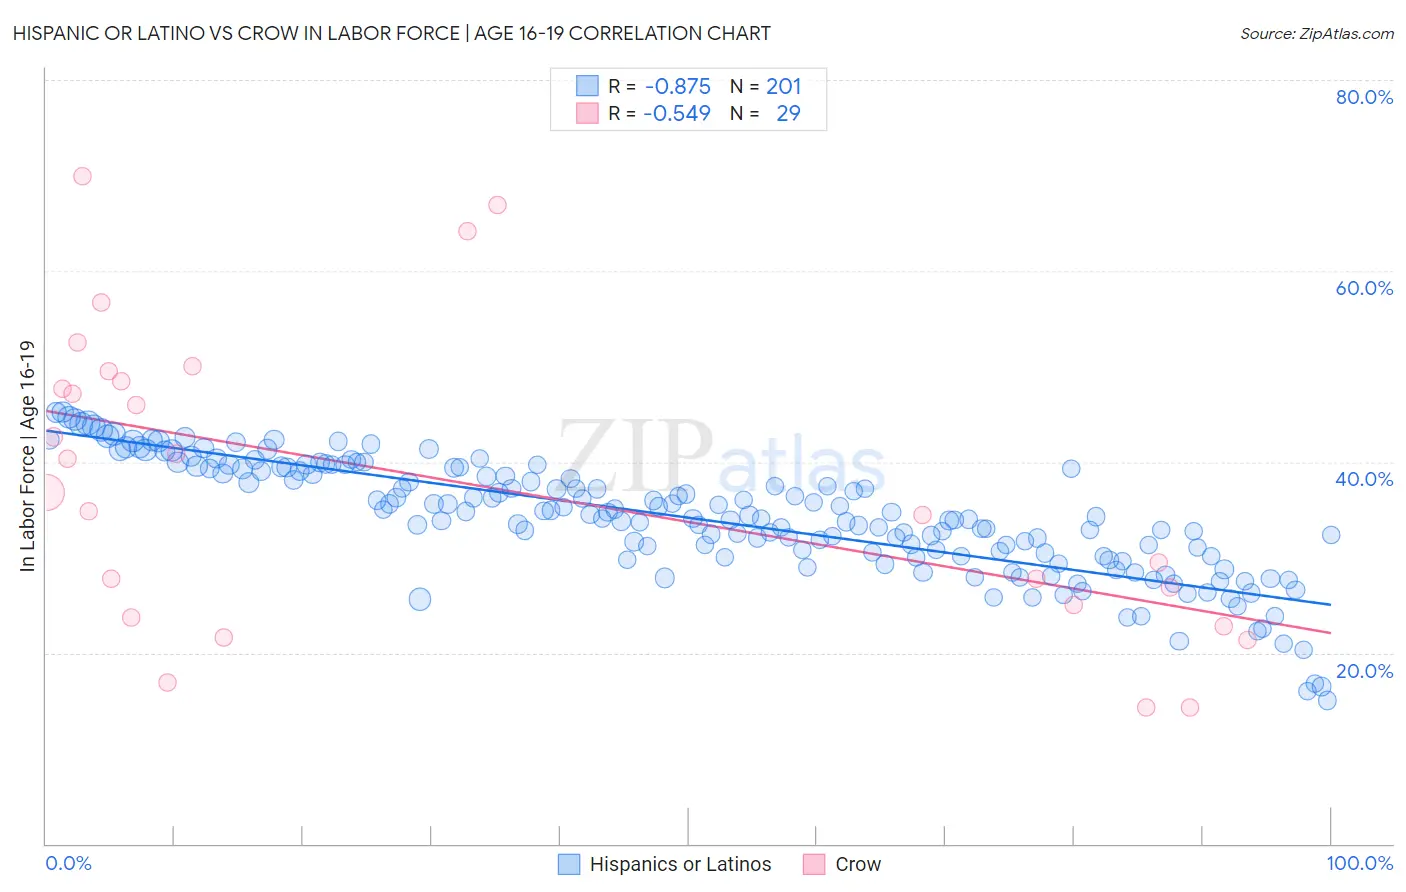
Hispanic or Latino vs Crow In Labor Force | Age 16-19 Correlation Chart
The statistical analysis conducted on geographies consisting of 573,733,594 people shows a very strong negative correlation between the proportion of Hispanics or Latinos and labor force participation rate among population between the ages 16 and 19 in the United States with a correlation coefficient (R) of -0.875 and weighted average of 34.5%. Similarly, the statistical analysis conducted on geographies consisting of 59,169,003 people shows a substantial negative correlation between the proportion of Crow and labor force participation rate among population between the ages 16 and 19 in the United States with a correlation coefficient (R) of -0.549 and weighted average of 38.5%, a difference of 11.6%.
In Labor Force | Age 16-19 Correlation Summary
| Measurement | Hispanic or Latino | Crow |
| Minimum | 15.0% | 14.3% |
| Maximum | 45.2% | 69.9% |
| Range | 30.2% | 55.6% |
| Mean | 34.1% | 38.0% |
| Median | 34.3% | 36.8% |
| Interquartile 25% (IQ1) | 30.2% | 24.4% |
| Interquartile 75% (IQ3) | 39.3% | 48.9% |
| Interquartile Range (IQR) | 9.1% | 24.6% |
| Standard Deviation (Sample) | 6.1% | 15.7% |
| Standard Deviation (Population) | 6.1% | 15.4% |
Similar Demographics by In Labor Force | Age 16-19
Demographics Similar to Hispanics or Latinos by In Labor Force | Age 16-19
In terms of in labor force | age 16-19, the demographic groups most similar to Hispanics or Latinos are Salvadoran (34.5%, a difference of 0.010%), Burmese (34.5%, a difference of 0.040%), Egyptian (34.5%, a difference of 0.050%), Immigrants (34.6%, a difference of 0.13%), and Immigrants from Egypt (34.6%, a difference of 0.15%).
| Demographics | Rating | Rank | In Labor Force | Age 16-19 |
| Peruvians | 1.4 /100 | #255 | Tragic 34.6% |
| Immigrants | South Central Asia | 1.3 /100 | #256 | Tragic 34.6% |
| Immigrants | Egypt | 1.2 /100 | #257 | Tragic 34.6% |
| Thais | 1.2 /100 | #258 | Tragic 34.6% |
| Immigrants | Immigrants | 1.2 /100 | #259 | Tragic 34.6% |
| Egyptians | 1.2 /100 | #260 | Tragic 34.5% |
| Salvadorans | 1.1 /100 | #261 | Tragic 34.5% |
| Hispanics or Latinos | 1.1 /100 | #262 | Tragic 34.5% |
| Burmese | 1.1 /100 | #263 | Tragic 34.5% |
| Immigrants | Uruguay | 0.9 /100 | #264 | Tragic 34.4% |
| Immigrants | El Salvador | 0.7 /100 | #265 | Tragic 34.3% |
| Immigrants | Malaysia | 0.7 /100 | #266 | Tragic 34.3% |
| Immigrants | Peru | 0.5 /100 | #267 | Tragic 34.2% |
| Immigrants | Asia | 0.5 /100 | #268 | Tragic 34.1% |
| Pima | 0.5 /100 | #269 | Tragic 34.1% |
Demographics Similar to Crow by In Labor Force | Age 16-19
In terms of in labor force | age 16-19, the demographic groups most similar to Crow are Immigrants from Scotland (38.5%, a difference of 0.010%), Maltese (38.5%, a difference of 0.060%), Subsaharan African (38.4%, a difference of 0.14%), Immigrants from Ethiopia (38.6%, a difference of 0.18%), and Lebanese (38.6%, a difference of 0.18%).
| Demographics | Rating | Rank | In Labor Force | Age 16-19 |
| Immigrants | Eritrea | 99.0 /100 | #104 | Exceptional 38.7% |
| Iraqis | 98.9 /100 | #105 | Exceptional 38.6% |
| Delaware | 98.8 /100 | #106 | Exceptional 38.6% |
| Chinese | 98.8 /100 | #107 | Exceptional 38.6% |
| Immigrants | Ethiopia | 98.7 /100 | #108 | Exceptional 38.6% |
| Lebanese | 98.7 /100 | #109 | Exceptional 38.6% |
| Maltese | 98.6 /100 | #110 | Exceptional 38.5% |
| Crow | 98.5 /100 | #111 | Exceptional 38.5% |
| Immigrants | Scotland | 98.5 /100 | #112 | Exceptional 38.5% |
| Sub-Saharan Africans | 98.3 /100 | #113 | Exceptional 38.4% |
| Hawaiians | 98.2 /100 | #114 | Exceptional 38.4% |
| Bulgarians | 97.9 /100 | #115 | Exceptional 38.3% |
| Colville | 97.9 /100 | #116 | Exceptional 38.3% |
| Chickasaw | 97.8 /100 | #117 | Exceptional 38.3% |
| Immigrants | Nepal | 97.8 /100 | #118 | Exceptional 38.3% |