Immigrants from Morocco vs Seminole In Labor Force | Age 20-64
COMPARE
Immigrants from Morocco
Seminole
In Labor Force | Age 20-64
In Labor Force | Age 20-64 Comparison
Immigrants from Morocco
Seminole
80.8%
IN LABOR FORCE | AGE 20-64
100.0/ 100
METRIC RATING
24th/ 347
METRIC RANK
75.5%
IN LABOR FORCE | AGE 20-64
0.0/ 100
METRIC RATING
321st/ 347
METRIC RANK
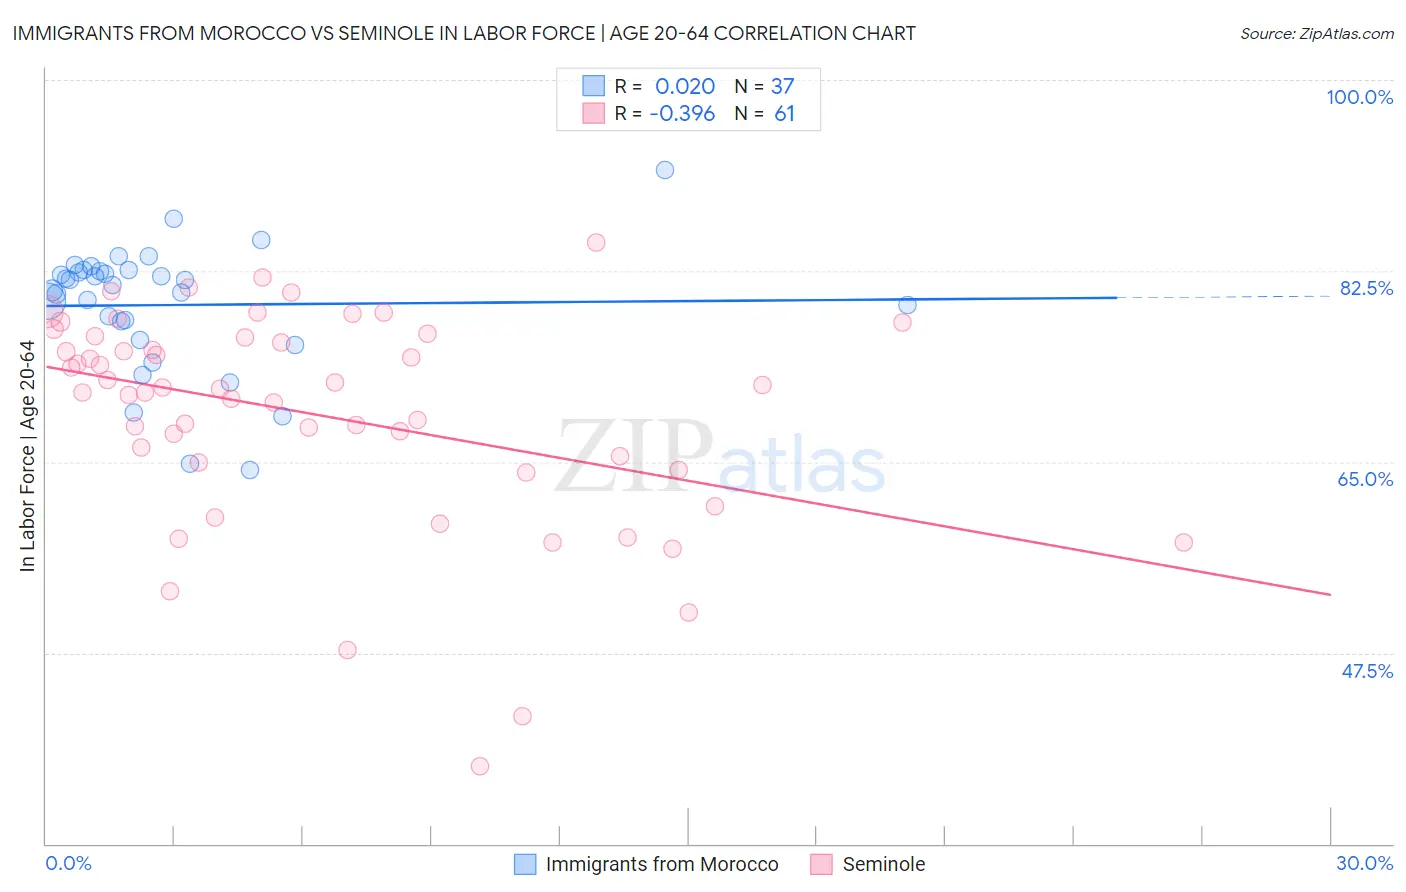
Immigrants from Morocco vs Seminole In Labor Force | Age 20-64 Correlation Chart
The statistical analysis conducted on geographies consisting of 178,912,438 people shows no correlation between the proportion of Immigrants from Morocco and labor force participation rate among population between the ages 20 and 64 in the United States with a correlation coefficient (R) of 0.020 and weighted average of 80.8%. Similarly, the statistical analysis conducted on geographies consisting of 118,311,145 people shows a mild negative correlation between the proportion of Seminole and labor force participation rate among population between the ages 20 and 64 in the United States with a correlation coefficient (R) of -0.396 and weighted average of 75.5%, a difference of 7.0%.
In Labor Force | Age 20-64 Correlation Summary
| Measurement | Immigrants from Morocco | Seminole |
| Minimum | 64.3% | 37.1% |
| Maximum | 91.8% | 85.1% |
| Range | 27.5% | 48.0% |
| Mean | 79.4% | 69.3% |
| Median | 81.2% | 71.7% |
| Interquartile 25% (IQ1) | 77.0% | 64.5% |
| Interquartile 75% (IQ3) | 82.5% | 76.5% |
| Interquartile Range (IQR) | 5.5% | 11.9% |
| Standard Deviation (Sample) | 5.8% | 9.9% |
| Standard Deviation (Population) | 5.7% | 9.8% |
Similar Demographics by In Labor Force | Age 20-64
Demographics Similar to Immigrants from Morocco by In Labor Force | Age 20-64
In terms of in labor force | age 20-64, the demographic groups most similar to Immigrants from Morocco are Immigrants from Bosnia and Herzegovina (80.8%, a difference of 0.010%), Kenyan (80.8%, a difference of 0.010%), Sudanese (80.8%, a difference of 0.020%), Immigrants from Serbia (80.8%, a difference of 0.030%), and Liberian (80.9%, a difference of 0.090%).
| Demographics | Rating | Rank | In Labor Force | Age 20-64 |
| Norwegians | 100.0 /100 | #17 | Exceptional 81.0% |
| Immigrants | Bulgaria | 100.0 /100 | #18 | Exceptional 81.0% |
| Zimbabweans | 100.0 /100 | #19 | Exceptional 81.0% |
| Thais | 100.0 /100 | #20 | Exceptional 80.9% |
| Liberians | 100.0 /100 | #21 | Exceptional 80.9% |
| Sudanese | 100.0 /100 | #22 | Exceptional 80.8% |
| Immigrants | Bosnia and Herzegovina | 100.0 /100 | #23 | Exceptional 80.8% |
| Immigrants | Morocco | 100.0 /100 | #24 | Exceptional 80.8% |
| Kenyans | 100.0 /100 | #25 | Exceptional 80.8% |
| Immigrants | Serbia | 100.0 /100 | #26 | Exceptional 80.8% |
| Immigrants | Kenya | 99.9 /100 | #27 | Exceptional 80.7% |
| Immigrants | Uganda | 99.9 /100 | #28 | Exceptional 80.7% |
| Immigrants | South Central Asia | 99.9 /100 | #29 | Exceptional 80.7% |
| Immigrants | North Macedonia | 99.9 /100 | #30 | Exceptional 80.7% |
| Immigrants | Lithuania | 99.9 /100 | #31 | Exceptional 80.7% |
Demographics Similar to Seminole by In Labor Force | Age 20-64
In terms of in labor force | age 20-64, the demographic groups most similar to Seminole are Dutch West Indian (75.5%, a difference of 0.050%), Cajun (75.5%, a difference of 0.090%), Choctaw (75.4%, a difference of 0.14%), Menominee (75.3%, a difference of 0.28%), and Yakama (75.8%, a difference of 0.35%).
| Demographics | Rating | Rank | In Labor Force | Age 20-64 |
| Blacks/African Americans | 0.0 /100 | #314 | Tragic 76.8% |
| Ottawa | 0.0 /100 | #315 | Tragic 76.7% |
| Yaqui | 0.0 /100 | #316 | Tragic 76.5% |
| Cherokee | 0.0 /100 | #317 | Tragic 76.2% |
| Chickasaw | 0.0 /100 | #318 | Tragic 76.2% |
| Inupiat | 0.0 /100 | #319 | Tragic 76.1% |
| Yakama | 0.0 /100 | #320 | Tragic 75.8% |
| Seminole | 0.0 /100 | #321 | Tragic 75.5% |
| Dutch West Indians | 0.0 /100 | #322 | Tragic 75.5% |
| Cajuns | 0.0 /100 | #323 | Tragic 75.5% |
| Choctaw | 0.0 /100 | #324 | Tragic 75.4% |
| Menominee | 0.0 /100 | #325 | Tragic 75.3% |
| Creek | 0.0 /100 | #326 | Tragic 75.1% |
| Sioux | 0.0 /100 | #327 | Tragic 75.0% |
| Kiowa | 0.0 /100 | #328 | Tragic 75.0% |