Immigrants from Barbados vs Seminole In Labor Force | Age 20-64
COMPARE
Immigrants from Barbados
Seminole
In Labor Force | Age 20-64
In Labor Force | Age 20-64 Comparison
Immigrants from Barbados
Seminole
78.3%
IN LABOR FORCE | AGE 20-64
0.0/ 100
METRIC RATING
269th/ 347
METRIC RANK
75.5%
IN LABOR FORCE | AGE 20-64
0.0/ 100
METRIC RATING
321st/ 347
METRIC RANK
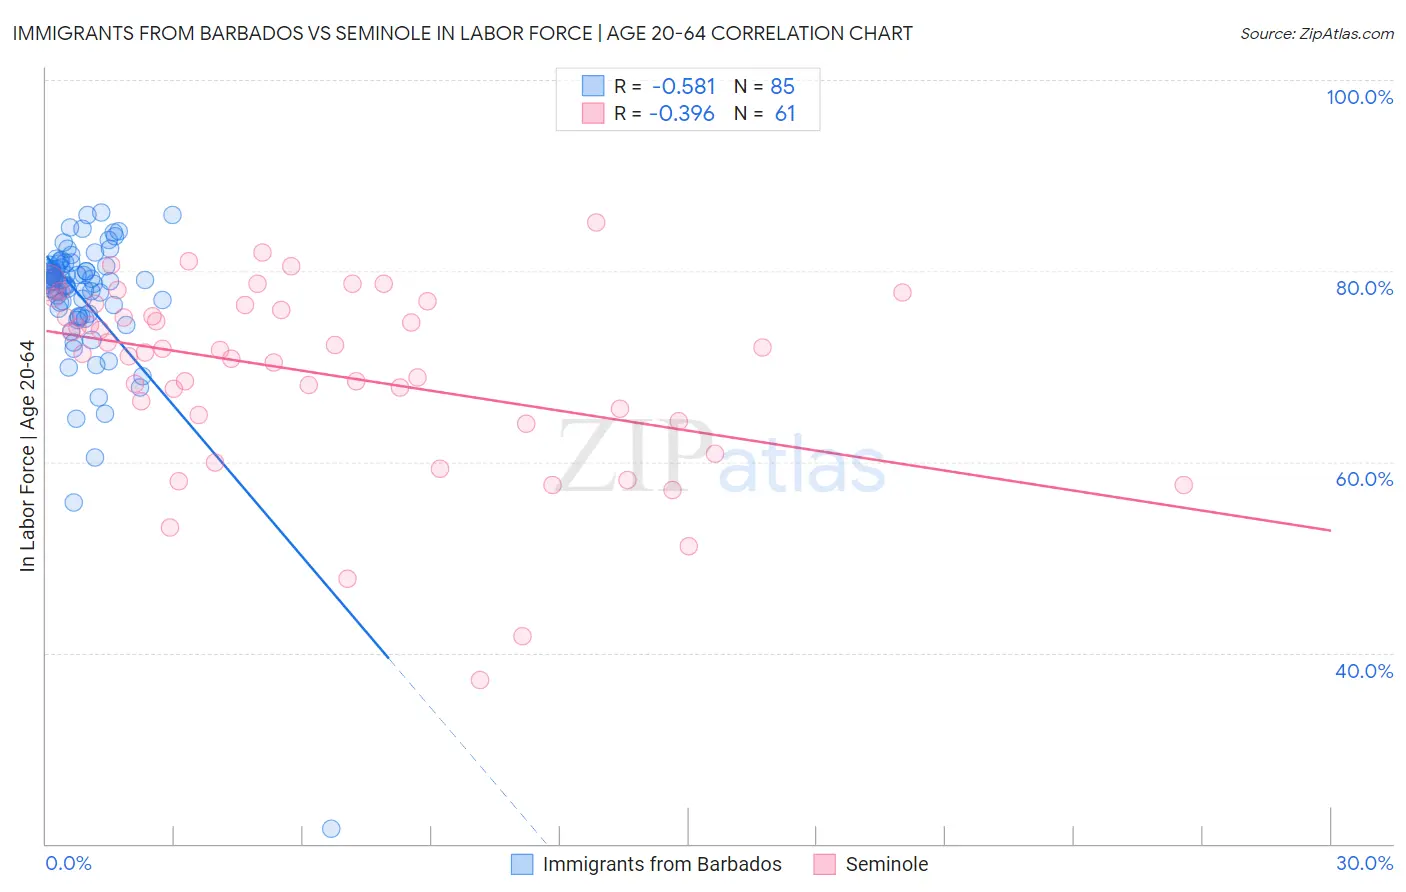
Immigrants from Barbados vs Seminole In Labor Force | Age 20-64 Correlation Chart
The statistical analysis conducted on geographies consisting of 112,778,506 people shows a substantial negative correlation between the proportion of Immigrants from Barbados and labor force participation rate among population between the ages 20 and 64 in the United States with a correlation coefficient (R) of -0.581 and weighted average of 78.3%. Similarly, the statistical analysis conducted on geographies consisting of 118,311,145 people shows a mild negative correlation between the proportion of Seminole and labor force participation rate among population between the ages 20 and 64 in the United States with a correlation coefficient (R) of -0.396 and weighted average of 75.5%, a difference of 3.7%.
In Labor Force | Age 20-64 Correlation Summary
| Measurement | Immigrants from Barbados | Seminole |
| Minimum | 21.6% | 37.1% |
| Maximum | 86.1% | 85.1% |
| Range | 64.5% | 48.0% |
| Mean | 77.0% | 69.3% |
| Median | 78.9% | 71.7% |
| Interquartile 25% (IQ1) | 75.4% | 64.5% |
| Interquartile 75% (IQ3) | 80.5% | 76.5% |
| Interquartile Range (IQR) | 5.1% | 11.9% |
| Standard Deviation (Sample) | 8.1% | 9.9% |
| Standard Deviation (Population) | 8.1% | 9.8% |
Similar Demographics by In Labor Force | Age 20-64
Demographics Similar to Immigrants from Barbados by In Labor Force | Age 20-64
In terms of in labor force | age 20-64, the demographic groups most similar to Immigrants from Barbados are Scotch-Irish (78.3%, a difference of 0.020%), Immigrants from Latin America (78.3%, a difference of 0.040%), Marshallese (78.3%, a difference of 0.040%), West Indian (78.3%, a difference of 0.050%), and U.S. Virgin Islander (78.4%, a difference of 0.070%).
| Demographics | Rating | Rank | In Labor Force | Age 20-64 |
| Fijians | 0.1 /100 | #262 | Tragic 78.4% |
| Pennsylvania Germans | 0.1 /100 | #263 | Tragic 78.4% |
| Spaniards | 0.1 /100 | #264 | Tragic 78.4% |
| British West Indians | 0.1 /100 | #265 | Tragic 78.4% |
| Bahamians | 0.1 /100 | #266 | Tragic 78.4% |
| U.S. Virgin Islanders | 0.1 /100 | #267 | Tragic 78.4% |
| West Indians | 0.0 /100 | #268 | Tragic 78.3% |
| Immigrants | Barbados | 0.0 /100 | #269 | Tragic 78.3% |
| Scotch-Irish | 0.0 /100 | #270 | Tragic 78.3% |
| Immigrants | Latin America | 0.0 /100 | #271 | Tragic 78.3% |
| Marshallese | 0.0 /100 | #272 | Tragic 78.3% |
| French American Indians | 0.0 /100 | #273 | Tragic 78.2% |
| Aleuts | 0.0 /100 | #274 | Tragic 78.2% |
| Spanish | 0.0 /100 | #275 | Tragic 78.2% |
| Puget Sound Salish | 0.0 /100 | #276 | Tragic 78.2% |
Demographics Similar to Seminole by In Labor Force | Age 20-64
In terms of in labor force | age 20-64, the demographic groups most similar to Seminole are Dutch West Indian (75.5%, a difference of 0.050%), Cajun (75.5%, a difference of 0.090%), Choctaw (75.4%, a difference of 0.14%), Menominee (75.3%, a difference of 0.28%), and Yakama (75.8%, a difference of 0.35%).
| Demographics | Rating | Rank | In Labor Force | Age 20-64 |
| Blacks/African Americans | 0.0 /100 | #314 | Tragic 76.8% |
| Ottawa | 0.0 /100 | #315 | Tragic 76.7% |
| Yaqui | 0.0 /100 | #316 | Tragic 76.5% |
| Cherokee | 0.0 /100 | #317 | Tragic 76.2% |
| Chickasaw | 0.0 /100 | #318 | Tragic 76.2% |
| Inupiat | 0.0 /100 | #319 | Tragic 76.1% |
| Yakama | 0.0 /100 | #320 | Tragic 75.8% |
| Seminole | 0.0 /100 | #321 | Tragic 75.5% |
| Dutch West Indians | 0.0 /100 | #322 | Tragic 75.5% |
| Cajuns | 0.0 /100 | #323 | Tragic 75.5% |
| Choctaw | 0.0 /100 | #324 | Tragic 75.4% |
| Menominee | 0.0 /100 | #325 | Tragic 75.3% |
| Creek | 0.0 /100 | #326 | Tragic 75.1% |
| Sioux | 0.0 /100 | #327 | Tragic 75.0% |
| Kiowa | 0.0 /100 | #328 | Tragic 75.0% |