Slovene vs European In Labor Force | Age > 16
COMPARE
Slovene
European
In Labor Force | Age > 16
In Labor Force | Age > 16 Comparison
Slovenes
Europeans
64.9%
IN LABOR FORCE | AGE > 16
18.7/ 100
METRIC RATING
204th/ 347
METRIC RANK
64.7%
IN LABOR FORCE | AGE > 16
8.3/ 100
METRIC RATING
226th/ 347
METRIC RANK
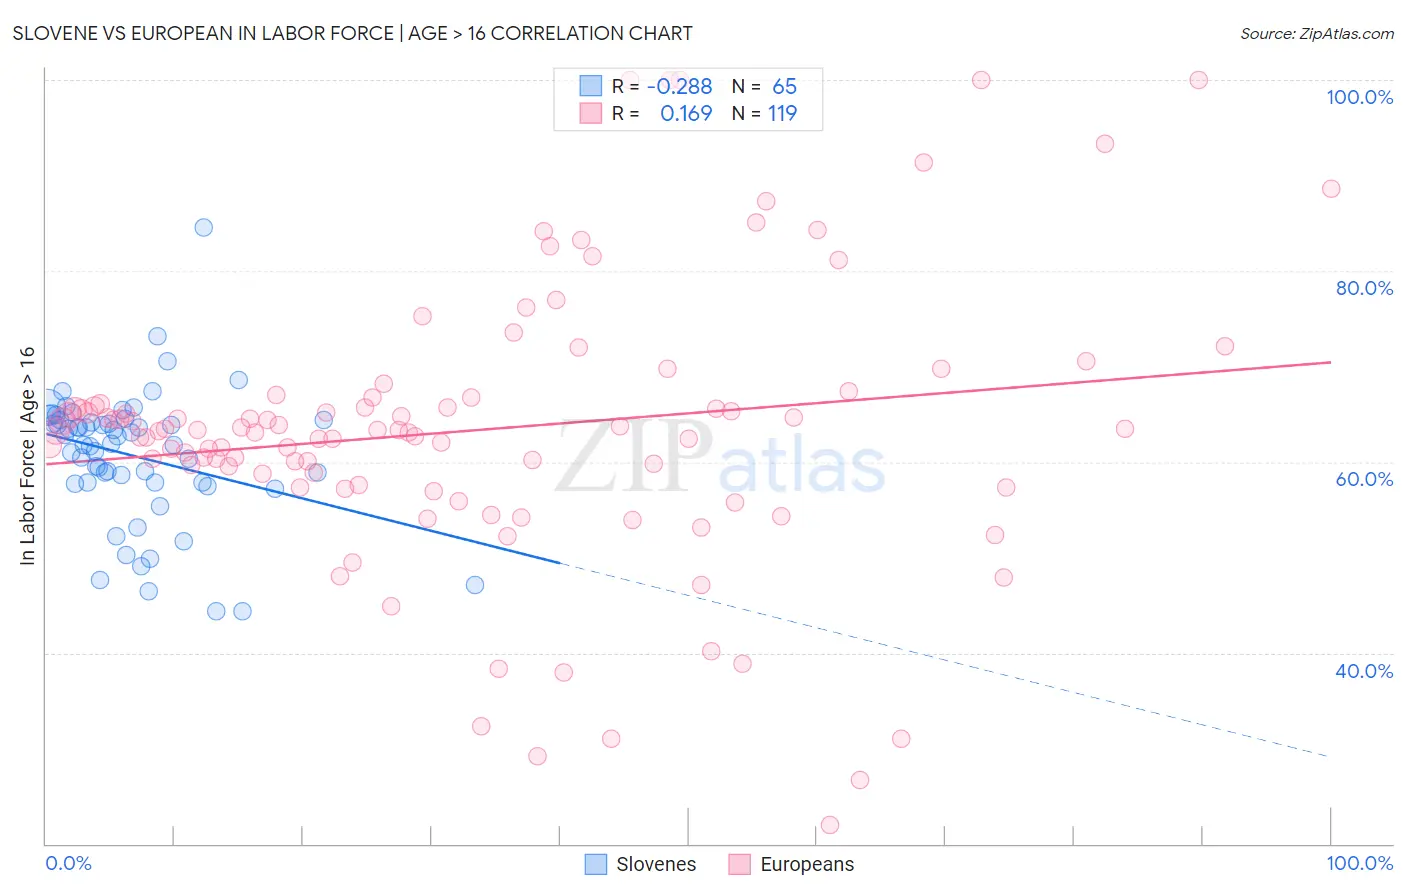
Slovene vs European In Labor Force | Age > 16 Correlation Chart
The statistical analysis conducted on geographies consisting of 261,356,181 people shows a weak negative correlation between the proportion of Slovenes and labor force participation rate among population ages 16 and over in the United States with a correlation coefficient (R) of -0.288 and weighted average of 64.9%. Similarly, the statistical analysis conducted on geographies consisting of 561,841,605 people shows a poor positive correlation between the proportion of Europeans and labor force participation rate among population ages 16 and over in the United States with a correlation coefficient (R) of 0.169 and weighted average of 64.7%, a difference of 0.26%.
In Labor Force | Age > 16 Correlation Summary
| Measurement | Slovene | European |
| Minimum | 44.4% | 22.0% |
| Maximum | 84.6% | 100.0% |
| Range | 40.2% | 78.0% |
| Mean | 60.6% | 63.4% |
| Median | 61.9% | 63.3% |
| Interquartile 25% (IQ1) | 57.9% | 57.6% |
| Interquartile 75% (IQ3) | 64.4% | 66.7% |
| Interquartile Range (IQR) | 6.6% | 9.1% |
| Standard Deviation (Sample) | 6.9% | 14.7% |
| Standard Deviation (Population) | 6.9% | 14.7% |
Similar Demographics by In Labor Force | Age > 16
Demographics Similar to Slovenes by In Labor Force | Age > 16
In terms of in labor force | age > 16, the demographic groups most similar to Slovenes are Russian (64.9%, a difference of 0.0%), Jamaican (64.9%, a difference of 0.0%), Immigrants from Belgium (64.9%, a difference of 0.010%), Ukrainian (64.9%, a difference of 0.020%), and Armenian (64.9%, a difference of 0.030%).
| Demographics | Rating | Rank | In Labor Force | Age > 16 |
| Immigrants | Italy | 28.7 /100 | #197 | Fair 65.0% |
| Greeks | 26.1 /100 | #198 | Fair 64.9% |
| Mexican American Indians | 23.1 /100 | #199 | Fair 64.9% |
| Armenians | 20.2 /100 | #200 | Fair 64.9% |
| Ukrainians | 19.6 /100 | #201 | Poor 64.9% |
| Immigrants | Belgium | 19.4 /100 | #202 | Poor 64.9% |
| Russians | 18.8 /100 | #203 | Poor 64.9% |
| Slovenes | 18.7 /100 | #204 | Poor 64.9% |
| Jamaicans | 18.7 /100 | #205 | Poor 64.9% |
| Lithuanians | 17.4 /100 | #206 | Poor 64.8% |
| Immigrants | Latin America | 16.4 /100 | #207 | Poor 64.8% |
| Belizeans | 16.2 /100 | #208 | Poor 64.8% |
| Immigrants | Trinidad and Tobago | 15.6 /100 | #209 | Poor 64.8% |
| Immigrants | Denmark | 14.7 /100 | #210 | Poor 64.8% |
| Fijians | 14.1 /100 | #211 | Poor 64.8% |
Demographics Similar to Europeans by In Labor Force | Age > 16
In terms of in labor force | age > 16, the demographic groups most similar to Europeans are Polish (64.7%, a difference of 0.0%), Northern European (64.7%, a difference of 0.0%), Immigrants from Jamaica (64.7%, a difference of 0.020%), Croatian (64.7%, a difference of 0.020%), and Immigrants from Belize (64.7%, a difference of 0.030%).
| Demographics | Rating | Rank | In Labor Force | Age > 16 |
| Immigrants | Central America | 10.5 /100 | #219 | Poor 64.7% |
| Alaska Natives | 9.9 /100 | #220 | Tragic 64.7% |
| Immigrants | Micronesia | 9.6 /100 | #221 | Tragic 64.7% |
| Hawaiians | 9.3 /100 | #222 | Tragic 64.7% |
| Immigrants | Belize | 9.2 /100 | #223 | Tragic 64.7% |
| Immigrants | Jamaica | 8.8 /100 | #224 | Tragic 64.7% |
| Croatians | 8.8 /100 | #225 | Tragic 64.7% |
| Europeans | 8.3 /100 | #226 | Tragic 64.7% |
| Poles | 8.3 /100 | #227 | Tragic 64.7% |
| Northern Europeans | 8.2 /100 | #228 | Tragic 64.7% |
| British | 7.3 /100 | #229 | Tragic 64.7% |
| Chinese | 7.3 /100 | #230 | Tragic 64.7% |
| Immigrants | Northern Europe | 7.2 /100 | #231 | Tragic 64.7% |
| Africans | 5.8 /100 | #232 | Tragic 64.6% |
| Slavs | 4.9 /100 | #233 | Tragic 64.6% |