Immigrants from Somalia vs European In Labor Force | Age > 16
COMPARE
Immigrants from Somalia
European
In Labor Force | Age > 16
In Labor Force | Age > 16 Comparison
Immigrants from Somalia
Europeans
69.1%
IN LABOR FORCE | AGE > 16
100.0/ 100
METRIC RATING
4th/ 347
METRIC RANK
64.7%
IN LABOR FORCE | AGE > 16
8.3/ 100
METRIC RATING
226th/ 347
METRIC RANK
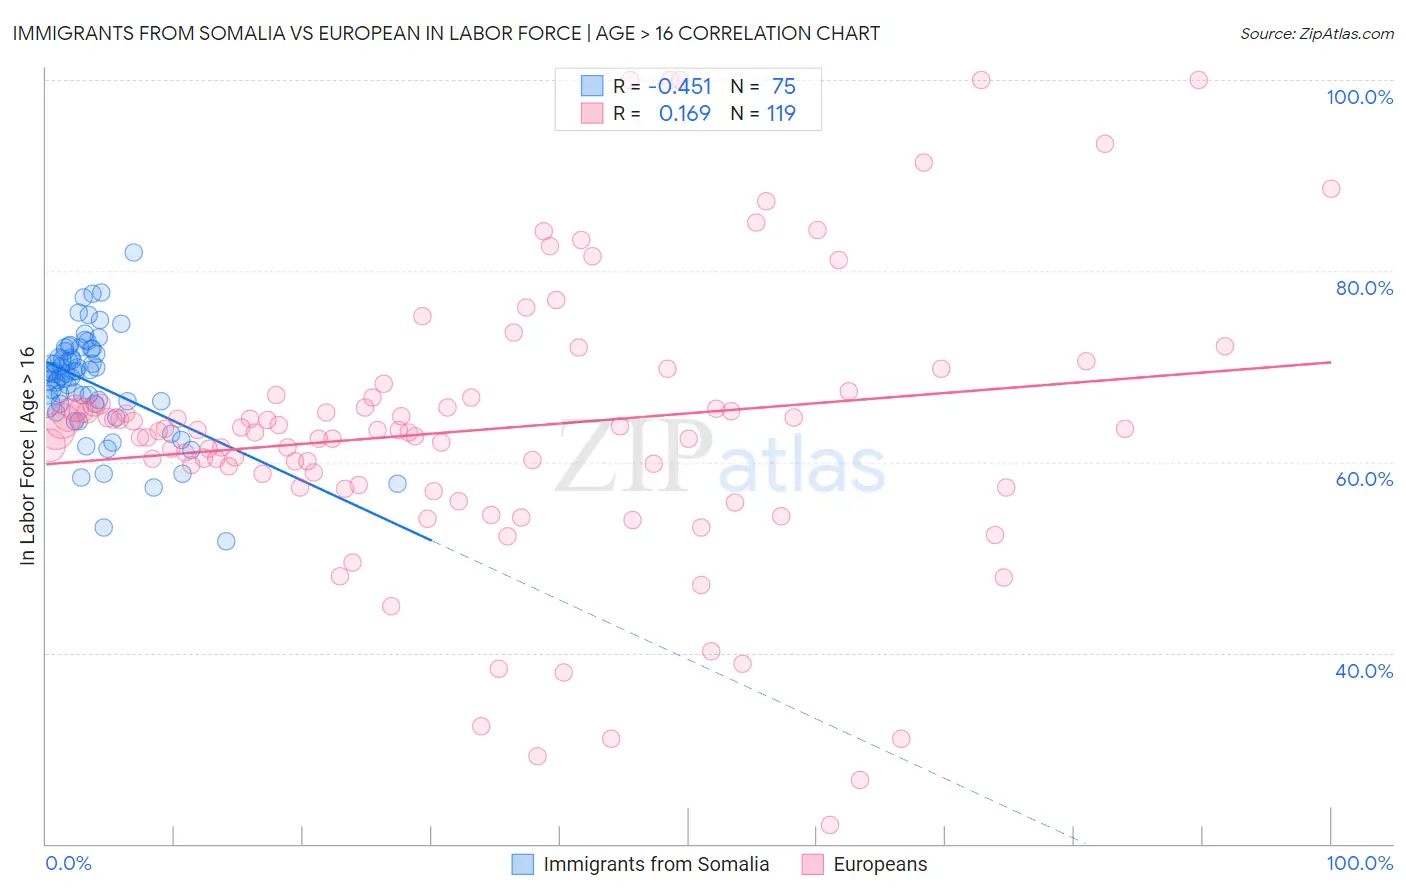
Immigrants from Somalia vs European In Labor Force | Age > 16 Correlation Chart
The statistical analysis conducted on geographies consisting of 92,107,842 people shows a moderate negative correlation between the proportion of Immigrants from Somalia and labor force participation rate among population ages 16 and over in the United States with a correlation coefficient (R) of -0.451 and weighted average of 69.1%. Similarly, the statistical analysis conducted on geographies consisting of 561,841,605 people shows a poor positive correlation between the proportion of Europeans and labor force participation rate among population ages 16 and over in the United States with a correlation coefficient (R) of 0.169 and weighted average of 64.7%, a difference of 6.9%.
In Labor Force | Age > 16 Correlation Summary
| Measurement | Immigrants from Somalia | European |
| Minimum | 51.7% | 22.0% |
| Maximum | 81.9% | 100.0% |
| Range | 30.2% | 78.0% |
| Mean | 68.2% | 63.4% |
| Median | 69.2% | 63.3% |
| Interquartile 25% (IQ1) | 66.1% | 57.6% |
| Interquartile 75% (IQ3) | 71.6% | 66.7% |
| Interquartile Range (IQR) | 5.5% | 9.1% |
| Standard Deviation (Sample) | 5.5% | 14.7% |
| Standard Deviation (Population) | 5.5% | 14.7% |
Similar Demographics by In Labor Force | Age > 16
Demographics Similar to Immigrants from Somalia by In Labor Force | Age > 16
In terms of in labor force | age > 16, the demographic groups most similar to Immigrants from Somalia are Somali (69.2%, a difference of 0.070%), Ethiopian (69.3%, a difference of 0.27%), Sierra Leonean (68.9%, a difference of 0.31%), Immigrants from Eritrea (68.9%, a difference of 0.36%), and Immigrants from Ethiopia (69.4%, a difference of 0.44%).
| Demographics | Rating | Rank | In Labor Force | Age > 16 |
| Immigrants | Ethiopia | 100.0 /100 | #1 | Exceptional 69.4% |
| Ethiopians | 100.0 /100 | #2 | Exceptional 69.3% |
| Somalis | 100.0 /100 | #3 | Exceptional 69.2% |
| Immigrants | Somalia | 100.0 /100 | #4 | Exceptional 69.1% |
| Sierra Leoneans | 100.0 /100 | #5 | Exceptional 68.9% |
| Immigrants | Eritrea | 100.0 /100 | #6 | Exceptional 68.9% |
| Immigrants | Cameroon | 100.0 /100 | #7 | Exceptional 68.7% |
| Immigrants | Sierra Leone | 100.0 /100 | #8 | Exceptional 68.5% |
| Immigrants | Eastern Africa | 100.0 /100 | #9 | Exceptional 68.5% |
| Immigrants | Bolivia | 100.0 /100 | #10 | Exceptional 68.4% |
| Bolivians | 100.0 /100 | #11 | Exceptional 68.2% |
| Sudanese | 100.0 /100 | #12 | Exceptional 68.0% |
| Immigrants | Nepal | 100.0 /100 | #13 | Exceptional 68.0% |
| Liberians | 100.0 /100 | #14 | Exceptional 67.8% |
| Immigrants | Middle Africa | 100.0 /100 | #15 | Exceptional 67.7% |
Demographics Similar to Europeans by In Labor Force | Age > 16
In terms of in labor force | age > 16, the demographic groups most similar to Europeans are Polish (64.7%, a difference of 0.0%), Northern European (64.7%, a difference of 0.0%), Immigrants from Jamaica (64.7%, a difference of 0.020%), Croatian (64.7%, a difference of 0.020%), and Immigrants from Belize (64.7%, a difference of 0.030%).
| Demographics | Rating | Rank | In Labor Force | Age > 16 |
| Immigrants | Central America | 10.5 /100 | #219 | Poor 64.7% |
| Alaska Natives | 9.9 /100 | #220 | Tragic 64.7% |
| Immigrants | Micronesia | 9.6 /100 | #221 | Tragic 64.7% |
| Hawaiians | 9.3 /100 | #222 | Tragic 64.7% |
| Immigrants | Belize | 9.2 /100 | #223 | Tragic 64.7% |
| Immigrants | Jamaica | 8.8 /100 | #224 | Tragic 64.7% |
| Croatians | 8.8 /100 | #225 | Tragic 64.7% |
| Europeans | 8.3 /100 | #226 | Tragic 64.7% |
| Poles | 8.3 /100 | #227 | Tragic 64.7% |
| Northern Europeans | 8.2 /100 | #228 | Tragic 64.7% |
| British | 7.3 /100 | #229 | Tragic 64.7% |
| Chinese | 7.3 /100 | #230 | Tragic 64.7% |
| Immigrants | Northern Europe | 7.2 /100 | #231 | Tragic 64.7% |
| Africans | 5.8 /100 | #232 | Tragic 64.6% |
| Slavs | 4.9 /100 | #233 | Tragic 64.6% |