Austrian vs Tlingit-Haida In Labor Force | Age 30-34
COMPARE
Austrian
Tlingit-Haida
In Labor Force | Age 30-34
In Labor Force | Age 30-34 Comparison
Austrians
Tlingit-Haida
85.0%
IN LABOR FORCE | AGE 30-34
90.9/ 100
METRIC RATING
126th/ 347
METRIC RANK
82.3%
IN LABOR FORCE | AGE 30-34
0.0/ 100
METRIC RATING
304th/ 347
METRIC RANK
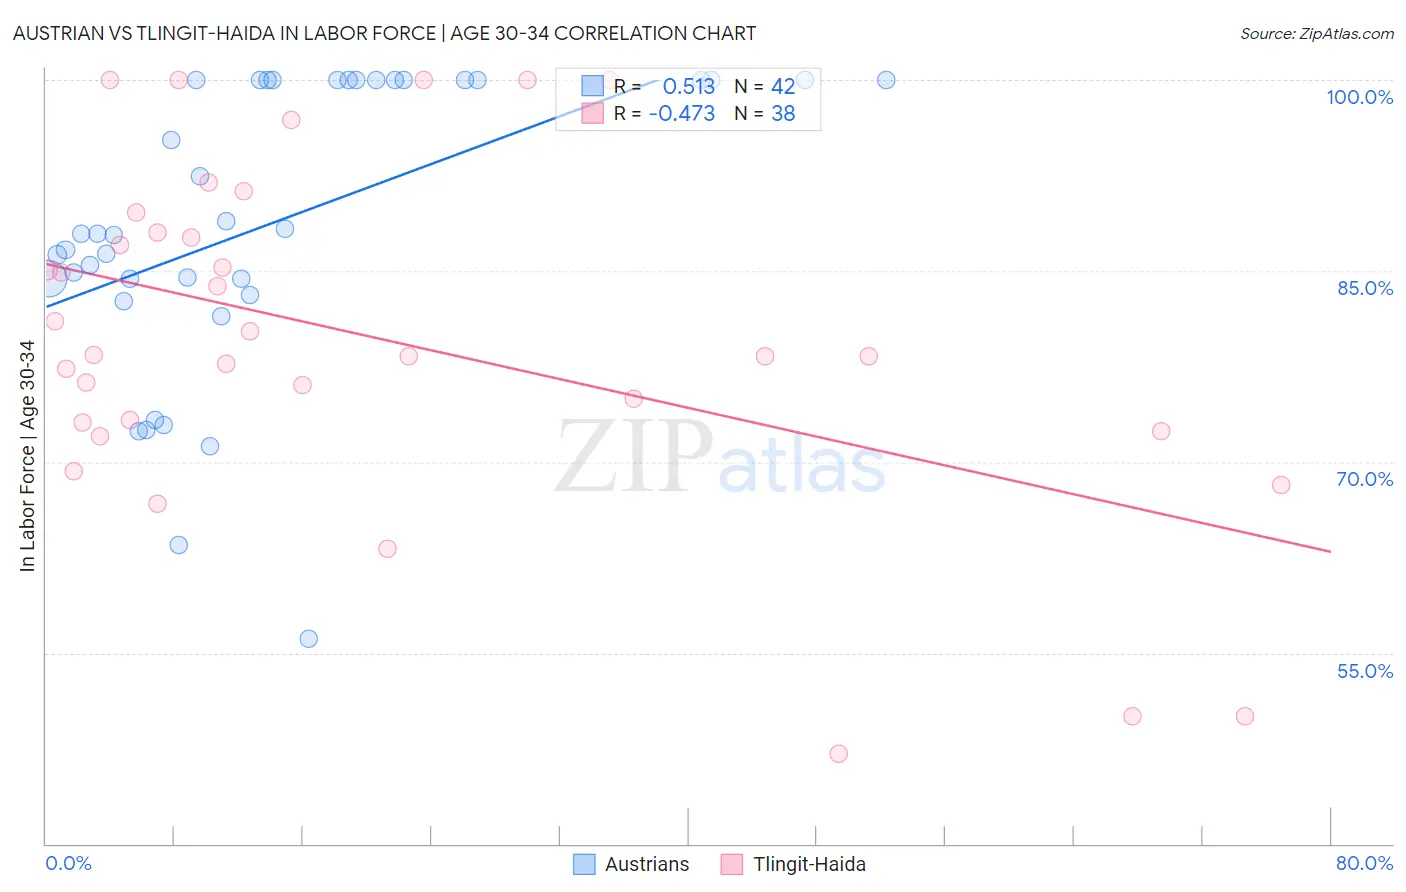
Austrian vs Tlingit-Haida In Labor Force | Age 30-34 Correlation Chart
The statistical analysis conducted on geographies consisting of 451,661,783 people shows a substantial positive correlation between the proportion of Austrians and labor force participation rate among population between the ages 30 and 34 in the United States with a correlation coefficient (R) of 0.513 and weighted average of 85.0%. Similarly, the statistical analysis conducted on geographies consisting of 60,864,119 people shows a moderate negative correlation between the proportion of Tlingit-Haida and labor force participation rate among population between the ages 30 and 34 in the United States with a correlation coefficient (R) of -0.473 and weighted average of 82.3%, a difference of 3.3%.
In Labor Force | Age 30-34 Correlation Summary
| Measurement | Austrian | Tlingit-Haida |
| Minimum | 56.1% | 47.1% |
| Maximum | 100.0% | 100.0% |
| Range | 43.9% | 52.9% |
| Mean | 88.7% | 79.8% |
| Median | 87.9% | 78.3% |
| Interquartile 25% (IQ1) | 84.4% | 73.1% |
| Interquartile 75% (IQ3) | 100.0% | 88.0% |
| Interquartile Range (IQR) | 15.6% | 14.9% |
| Standard Deviation (Sample) | 11.4% | 13.6% |
| Standard Deviation (Population) | 11.3% | 13.4% |
Similar Demographics by In Labor Force | Age 30-34
Demographics Similar to Austrians by In Labor Force | Age 30-34
In terms of in labor force | age 30-34, the demographic groups most similar to Austrians are Slavic (85.0%, a difference of 0.0%), Immigrants from Jordan (85.0%, a difference of 0.010%), Immigrants from Argentina (85.0%, a difference of 0.010%), Australian (85.0%, a difference of 0.020%), and Immigrants from Western Africa (85.0%, a difference of 0.020%).
| Demographics | Rating | Rank | In Labor Force | Age 30-34 |
| Asians | 93.4 /100 | #119 | Exceptional 85.1% |
| Immigrants | Southern Europe | 93.3 /100 | #120 | Exceptional 85.1% |
| Immigrants | Egypt | 93.2 /100 | #121 | Exceptional 85.1% |
| Immigrants | Kuwait | 92.6 /100 | #122 | Exceptional 85.1% |
| Armenians | 92.2 /100 | #123 | Exceptional 85.0% |
| Australians | 92.0 /100 | #124 | Exceptional 85.0% |
| Immigrants | Jordan | 91.5 /100 | #125 | Exceptional 85.0% |
| Austrians | 90.9 /100 | #126 | Exceptional 85.0% |
| Slavs | 90.7 /100 | #127 | Exceptional 85.0% |
| Immigrants | Argentina | 90.6 /100 | #128 | Exceptional 85.0% |
| Immigrants | Western Africa | 90.2 /100 | #129 | Exceptional 85.0% |
| Immigrants | Spain | 90.0 /100 | #130 | Exceptional 85.0% |
| Chinese | 89.6 /100 | #131 | Excellent 85.0% |
| Immigrants | Israel | 89.5 /100 | #132 | Excellent 85.0% |
| New Zealanders | 89.5 /100 | #133 | Excellent 85.0% |
Demographics Similar to Tlingit-Haida by In Labor Force | Age 30-34
In terms of in labor force | age 30-34, the demographic groups most similar to Tlingit-Haida are Immigrants from Micronesia (82.4%, a difference of 0.080%), Osage (82.3%, a difference of 0.080%), Ottawa (82.4%, a difference of 0.090%), Spanish American Indian (82.2%, a difference of 0.090%), and Hispanic or Latino (82.4%, a difference of 0.12%).
| Demographics | Rating | Rank | In Labor Force | Age 30-34 |
| Comanche | 0.0 /100 | #297 | Tragic 82.6% |
| Aleuts | 0.0 /100 | #298 | Tragic 82.6% |
| Immigrants | Central America | 0.0 /100 | #299 | Tragic 82.5% |
| Hmong | 0.0 /100 | #300 | Tragic 82.4% |
| Hispanics or Latinos | 0.0 /100 | #301 | Tragic 82.4% |
| Ottawa | 0.0 /100 | #302 | Tragic 82.4% |
| Immigrants | Micronesia | 0.0 /100 | #303 | Tragic 82.4% |
| Tlingit-Haida | 0.0 /100 | #304 | Tragic 82.3% |
| Osage | 0.0 /100 | #305 | Tragic 82.3% |
| Spanish American Indians | 0.0 /100 | #306 | Tragic 82.2% |
| Menominee | 0.0 /100 | #307 | Tragic 82.2% |
| Puget Sound Salish | 0.0 /100 | #308 | Tragic 82.1% |
| Immigrants | Mexico | 0.0 /100 | #309 | Tragic 82.0% |
| Cajuns | 0.0 /100 | #310 | Tragic 82.0% |
| Chickasaw | 0.0 /100 | #311 | Tragic 81.9% |