Welsh vs African In Labor Force | Age 30-34
COMPARE
Welsh
African
In Labor Force | Age 30-34
In Labor Force | Age 30-34 Comparison
Welsh
Africans
84.2%
IN LABOR FORCE | AGE 30-34
2.7/ 100
METRIC RATING
229th/ 347
METRIC RANK
83.4%
IN LABOR FORCE | AGE 30-34
0.0/ 100
METRIC RATING
280th/ 347
METRIC RANK
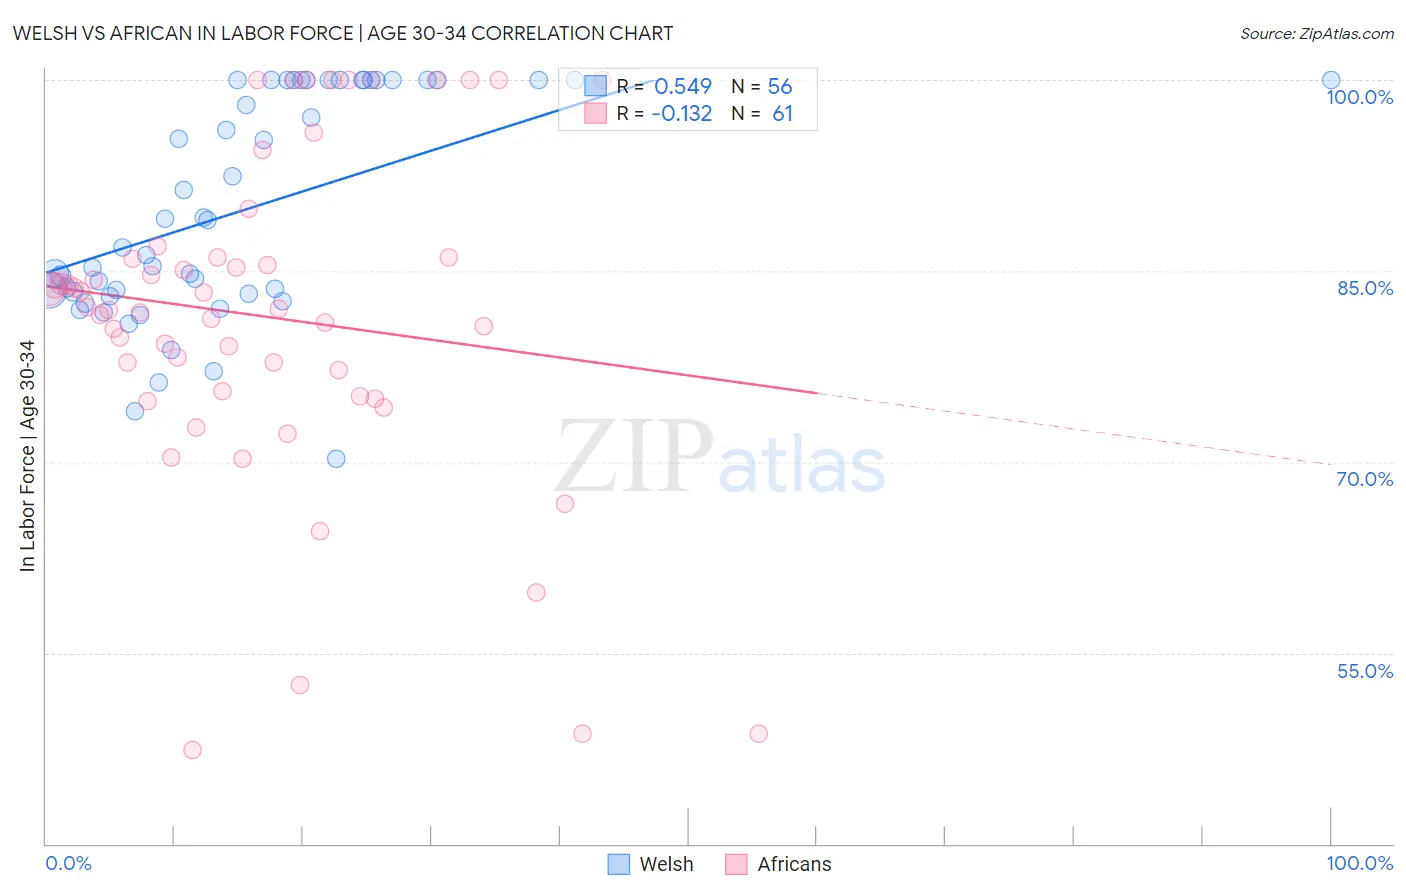
Welsh vs African In Labor Force | Age 30-34 Correlation Chart
The statistical analysis conducted on geographies consisting of 527,874,569 people shows a substantial positive correlation between the proportion of Welsh and labor force participation rate among population between the ages 30 and 34 in the United States with a correlation coefficient (R) of 0.549 and weighted average of 84.2%. Similarly, the statistical analysis conducted on geographies consisting of 469,594,480 people shows a poor negative correlation between the proportion of Africans and labor force participation rate among population between the ages 30 and 34 in the United States with a correlation coefficient (R) of -0.132 and weighted average of 83.4%, a difference of 0.94%.
In Labor Force | Age 30-34 Correlation Summary
| Measurement | Welsh | African |
| Minimum | 70.3% | 47.4% |
| Maximum | 100.0% | 100.0% |
| Range | 29.7% | 52.6% |
| Mean | 89.9% | 81.4% |
| Median | 87.9% | 82.1% |
| Interquartile 25% (IQ1) | 83.3% | 75.4% |
| Interquartile 75% (IQ3) | 100.0% | 86.1% |
| Interquartile Range (IQR) | 16.7% | 10.7% |
| Standard Deviation (Sample) | 8.7% | 12.9% |
| Standard Deviation (Population) | 8.6% | 12.7% |
Similar Demographics by In Labor Force | Age 30-34
Demographics Similar to Welsh by In Labor Force | Age 30-34
In terms of in labor force | age 30-34, the demographic groups most similar to Welsh are Immigrants from Cuba (84.2%, a difference of 0.010%), Immigrants from Haiti (84.2%, a difference of 0.010%), Immigrants from Bahamas (84.1%, a difference of 0.010%), Scottish (84.2%, a difference of 0.020%), and Immigrants from El Salvador (84.2%, a difference of 0.020%).
| Demographics | Rating | Rank | In Labor Force | Age 30-34 |
| Panamanians | 3.8 /100 | #222 | Tragic 84.2% |
| Immigrants | Laos | 3.6 /100 | #223 | Tragic 84.2% |
| Cubans | 3.4 /100 | #224 | Tragic 84.2% |
| Scottish | 3.1 /100 | #225 | Tragic 84.2% |
| Immigrants | El Salvador | 3.0 /100 | #226 | Tragic 84.2% |
| Immigrants | Cuba | 3.0 /100 | #227 | Tragic 84.2% |
| Immigrants | Haiti | 2.8 /100 | #228 | Tragic 84.2% |
| Welsh | 2.7 /100 | #229 | Tragic 84.2% |
| Immigrants | Bahamas | 2.6 /100 | #230 | Tragic 84.1% |
| Malaysians | 2.2 /100 | #231 | Tragic 84.1% |
| Immigrants | Immigrants | 2.0 /100 | #232 | Tragic 84.1% |
| West Indians | 1.9 /100 | #233 | Tragic 84.1% |
| Haitians | 1.8 /100 | #234 | Tragic 84.1% |
| French American Indians | 1.7 /100 | #235 | Tragic 84.1% |
| U.S. Virgin Islanders | 1.5 /100 | #236 | Tragic 84.1% |
Demographics Similar to Africans by In Labor Force | Age 30-34
In terms of in labor force | age 30-34, the demographic groups most similar to Africans are Immigrants from Fiji (83.4%, a difference of 0.030%), Fijian (83.4%, a difference of 0.040%), Delaware (83.5%, a difference of 0.10%), Immigrants from Grenada (83.5%, a difference of 0.12%), and Tongan (83.5%, a difference of 0.12%).
| Demographics | Rating | Rank | In Labor Force | Age 30-34 |
| Guamanians/Chamorros | 0.0 /100 | #273 | Tragic 83.5% |
| Belizeans | 0.0 /100 | #274 | Tragic 83.5% |
| Immigrants | Grenada | 0.0 /100 | #275 | Tragic 83.5% |
| Tongans | 0.0 /100 | #276 | Tragic 83.5% |
| Delaware | 0.0 /100 | #277 | Tragic 83.5% |
| Fijians | 0.0 /100 | #278 | Tragic 83.4% |
| Immigrants | Fiji | 0.0 /100 | #279 | Tragic 83.4% |
| Africans | 0.0 /100 | #280 | Tragic 83.4% |
| Samoans | 0.0 /100 | #281 | Tragic 83.3% |
| Mexican American Indians | 0.0 /100 | #282 | Tragic 83.2% |
| Assyrians/Chaldeans/Syriacs | 0.0 /100 | #283 | Tragic 83.2% |
| Immigrants | Belize | 0.0 /100 | #284 | Tragic 83.2% |
| Cree | 0.0 /100 | #285 | Tragic 83.2% |
| Immigrants | Latin America | 0.0 /100 | #286 | Tragic 83.1% |
| Native Hawaiians | 0.0 /100 | #287 | Tragic 83.0% |