Welsh vs Dutch West Indian In Labor Force | Age 16-19
COMPARE
Welsh
Dutch West Indian
In Labor Force | Age 16-19
In Labor Force | Age 16-19 Comparison
Welsh
Dutch West Indians
42.3%
IN LABOR FORCE | AGE 16-19
100.0/ 100
METRIC RATING
27th/ 347
METRIC RANK
35.6%
IN LABOR FORCE | AGE 16-19
10.7/ 100
METRIC RATING
216th/ 347
METRIC RANK
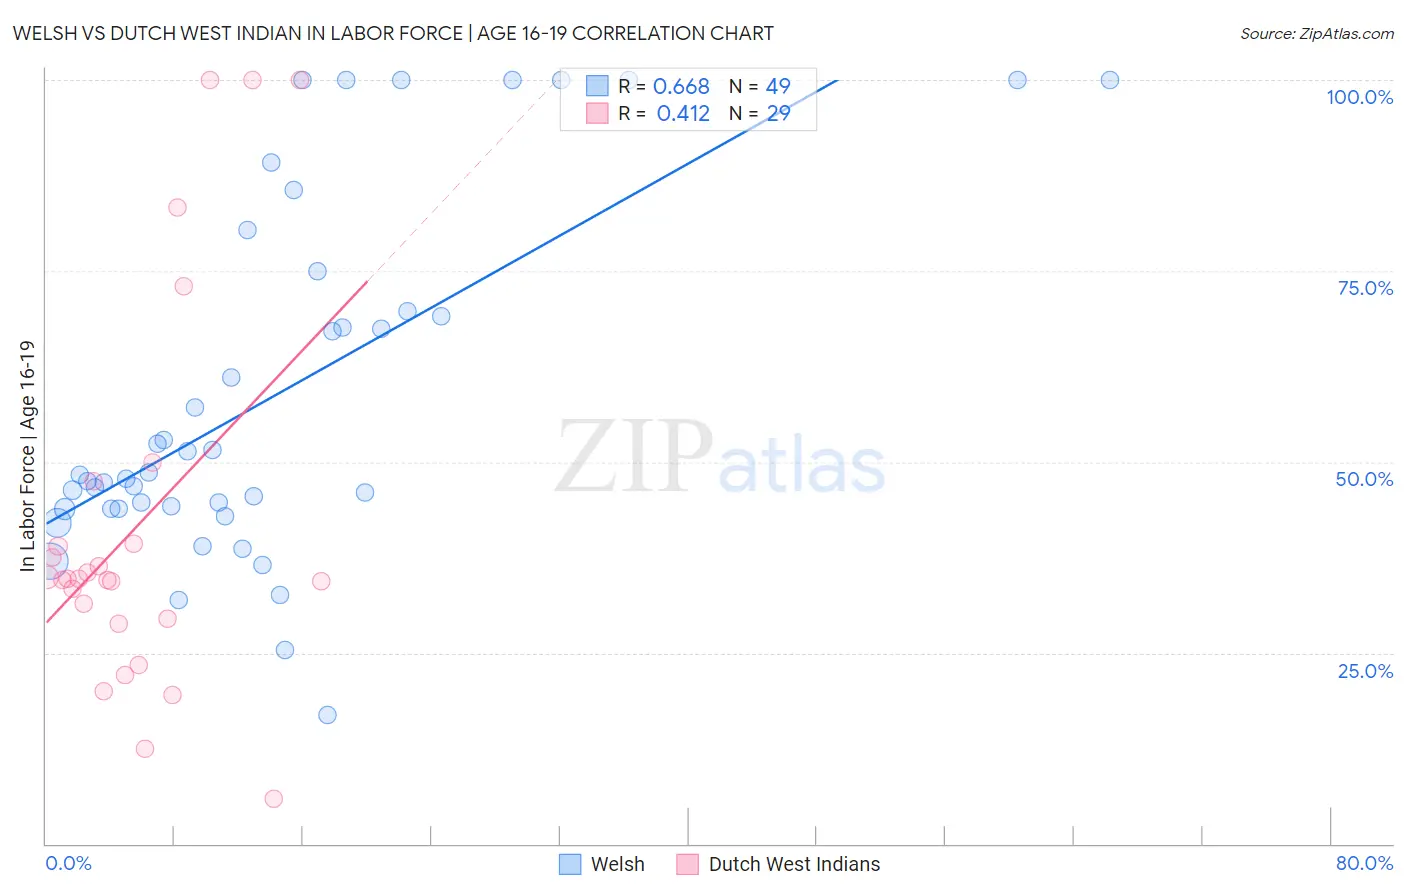
Welsh vs Dutch West Indian In Labor Force | Age 16-19 Correlation Chart
The statistical analysis conducted on geographies consisting of 526,098,531 people shows a significant positive correlation between the proportion of Welsh and labor force participation rate among population between the ages 16 and 19 in the United States with a correlation coefficient (R) of 0.668 and weighted average of 42.3%. Similarly, the statistical analysis conducted on geographies consisting of 85,687,209 people shows a moderate positive correlation between the proportion of Dutch West Indians and labor force participation rate among population between the ages 16 and 19 in the United States with a correlation coefficient (R) of 0.412 and weighted average of 35.6%, a difference of 18.7%.
In Labor Force | Age 16-19 Correlation Summary
| Measurement | Welsh | Dutch West Indian |
| Minimum | 16.8% | 5.9% |
| Maximum | 100.0% | 100.0% |
| Range | 83.2% | 94.1% |
| Mean | 58.7% | 41.7% |
| Median | 48.3% | 34.6% |
| Interquartile 25% (IQ1) | 43.9% | 29.1% |
| Interquartile 75% (IQ3) | 72.3% | 43.4% |
| Interquartile Range (IQR) | 28.4% | 14.3% |
| Standard Deviation (Sample) | 23.2% | 25.2% |
| Standard Deviation (Population) | 23.0% | 24.8% |
Similar Demographics by In Labor Force | Age 16-19
Demographics Similar to Welsh by In Labor Force | Age 16-19
In terms of in labor force | age 16-19, the demographic groups most similar to Welsh are English (42.4%, a difference of 0.28%), Polish (42.1%, a difference of 0.29%), French (42.1%, a difference of 0.35%), German Russian (42.4%, a difference of 0.40%), and Bangladeshi (42.5%, a difference of 0.48%).
| Demographics | Rating | Rank | In Labor Force | Age 16-19 |
| Swiss | 100.0 /100 | #20 | Exceptional 43.3% |
| Ottawa | 100.0 /100 | #21 | Exceptional 43.0% |
| Sudanese | 100.0 /100 | #22 | Exceptional 42.9% |
| Slovaks | 100.0 /100 | #23 | Exceptional 42.6% |
| Bangladeshis | 100.0 /100 | #24 | Exceptional 42.5% |
| German Russians | 100.0 /100 | #25 | Exceptional 42.4% |
| English | 100.0 /100 | #26 | Exceptional 42.4% |
| Welsh | 100.0 /100 | #27 | Exceptional 42.3% |
| Poles | 100.0 /100 | #28 | Exceptional 42.1% |
| French | 100.0 /100 | #29 | Exceptional 42.1% |
| Scottish | 100.0 /100 | #30 | Exceptional 42.0% |
| Irish | 100.0 /100 | #31 | Exceptional 42.0% |
| Czechoslovakians | 100.0 /100 | #32 | Exceptional 41.9% |
| Liberians | 100.0 /100 | #33 | Exceptional 41.8% |
| Immigrants | Bosnia and Herzegovina | 100.0 /100 | #34 | Exceptional 41.8% |
Demographics Similar to Dutch West Indians by In Labor Force | Age 16-19
In terms of in labor force | age 16-19, the demographic groups most similar to Dutch West Indians are Immigrants from Costa Rica (35.6%, a difference of 0.0%), Immigrants from South Eastern Asia (35.6%, a difference of 0.020%), Apache (35.6%, a difference of 0.040%), Houma (35.6%, a difference of 0.050%), and Immigrants from Bolivia (35.6%, a difference of 0.050%).
| Demographics | Rating | Rank | In Labor Force | Age 16-19 |
| Moroccans | 12.7 /100 | #209 | Poor 35.7% |
| Immigrants | Switzerland | 11.9 /100 | #210 | Poor 35.6% |
| Mexicans | 11.9 /100 | #211 | Poor 35.6% |
| Houma | 11.0 /100 | #212 | Poor 35.6% |
| Immigrants | Bolivia | 11.0 /100 | #213 | Poor 35.6% |
| Apache | 11.0 /100 | #214 | Poor 35.6% |
| Immigrants | South Eastern Asia | 10.8 /100 | #215 | Poor 35.6% |
| Dutch West Indians | 10.7 /100 | #216 | Poor 35.6% |
| Immigrants | Costa Rica | 10.7 /100 | #217 | Poor 35.6% |
| Sri Lankans | 9.8 /100 | #218 | Tragic 35.5% |
| Guatemalans | 8.6 /100 | #219 | Tragic 35.5% |
| Immigrants | Bahamas | 8.3 /100 | #220 | Tragic 35.5% |
| Turks | 7.3 /100 | #221 | Tragic 35.4% |
| Immigrants | Ghana | 7.3 /100 | #222 | Tragic 35.4% |
| Ghanaians | 6.5 /100 | #223 | Tragic 35.3% |